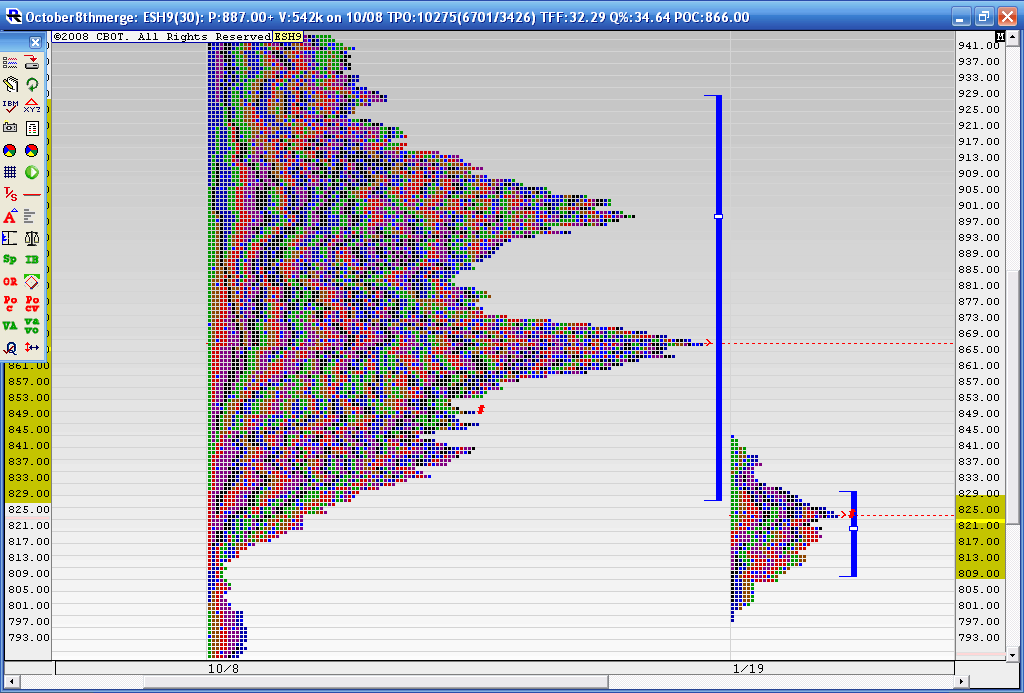
Merged Profile
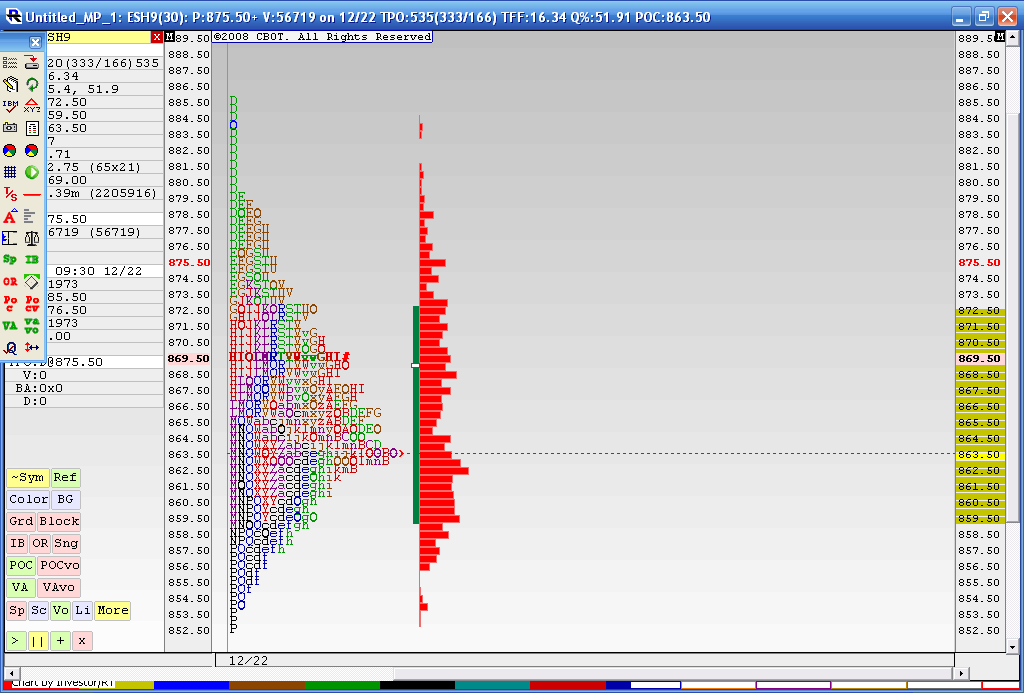
Below is the result from a 4 day merged profile as this is where we most recently have consolidated during holiday trade. The Value area high of this merge is 872.50 and the Value area low is 59.50. You may also notice that the 863.50 price has had the most trade through so far. This chart doesn't include today's trading. I think that 59.50 - 63.50 is the area we need to beat for any upside to take hold as we have the Va low and that Volume node. Current overnight high is 73.50 so it was fairly close to the merged VA high of 72.50.
In today's trading we have single prints created to the downside and through that high volume node. I'm skeptical because of the holidays and low volume but as most know we will trend many times after consolidations. I'm not sure if this counts. Anyway it's been fun firing up the old MP software for a change.
To make a long story longer: That 859.50 - 863.50 is the critical zone to watch.
If I can think of anything man I'll let you know. You definitely seem to be on the right track. Cisco has some good info on trading breakouts from longer term balances.
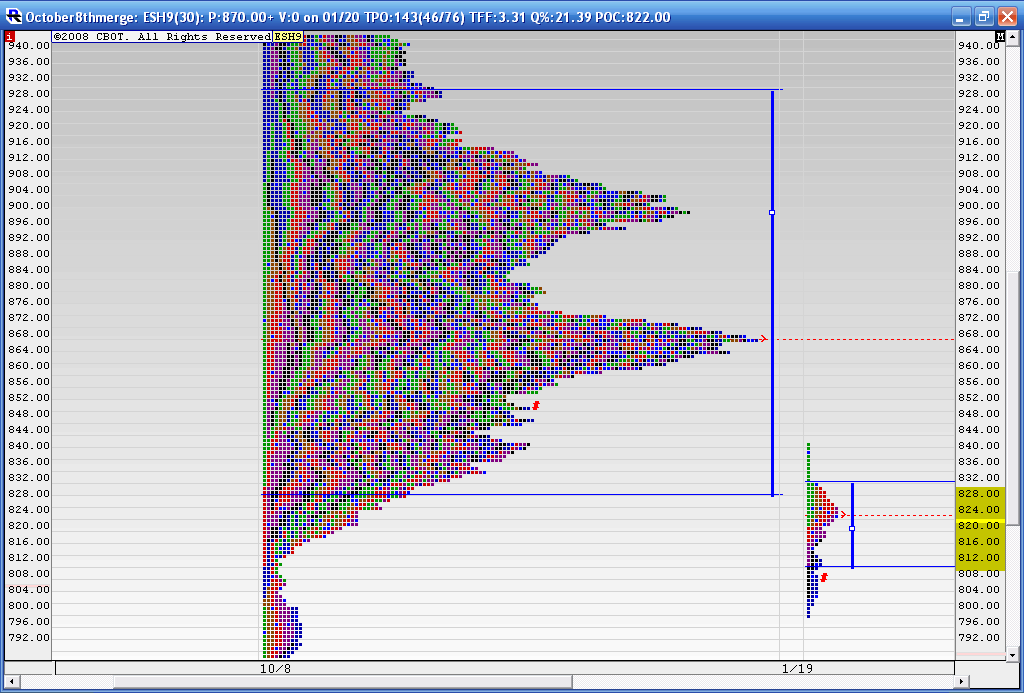
Here is the breakout from the longer term Value area that happened today. What I'd like to know if this really has any significance. Will the unfair prices at these lows actually attract buyers to push prices up to fill in those low volume areas I've been speaking of above the 866 area and higher to give a more complete bell shape profile or is that just a bunch of theory that looks good on charts after the fact put out there by vendors....
ON the other hand will Value migrate down towards price to test the 2008 lows....unfortunately there are no solid rules for these longer term profiles. I'm very skeptical of these longer term ideas.....the fact that nobody responded to my Steidlmayer, Dalton and Jones thread telling me that those educators actually trade should be a concern.
I guess we'll see....I'm still leaning towards a filling in of that low volume area above before any meaning ful move takes place....
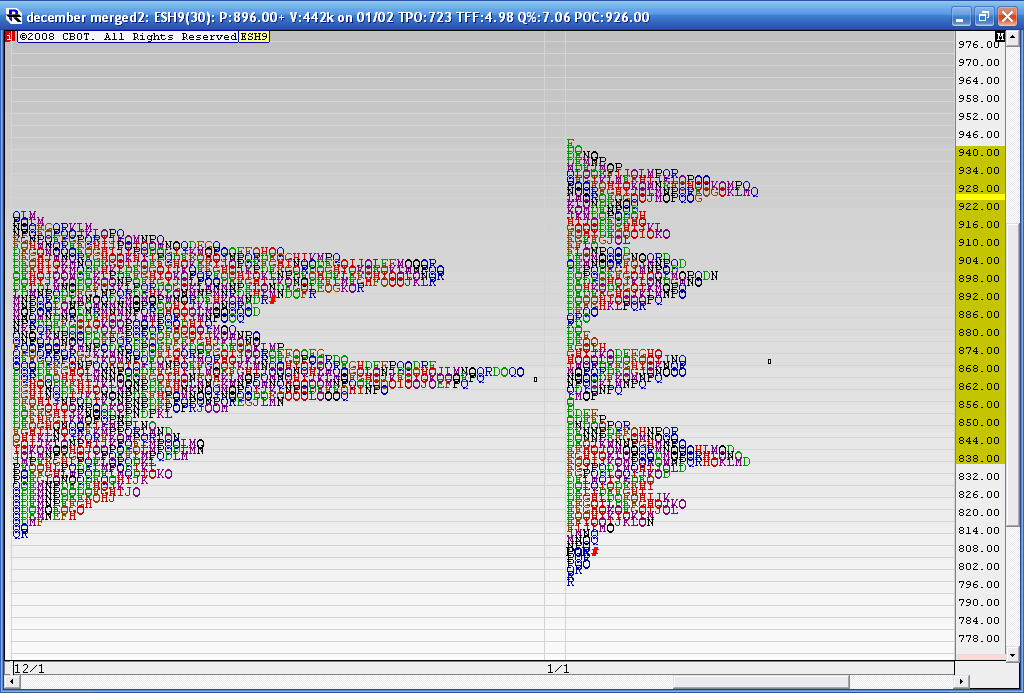
What I'm showing here is the merged profile for all of December and the all of January so far.....this may be selective or wishful thinking but if we take the range of Januarys Highs to decembers highs and then subtract that amount from Decemebrs lows we get down into the 789 area.....This would be the same as taking the amount of the range extension up when we get a 60 minute high break out and then subtracting that same amount from the low if we get a Range extension to the downside....then we would look to see if we would close in the middle or on an extreme............Sometimes I just can't type my thoughts......does that make sense so far..?
Ok so I'm, basically seeing if we extend down below Decembers range the same amount we extended above the range......
The middle of January's range is (944 + 797.50 ) and then divide by two..gets us back up into the 860 - 880 area....or we can use the full projection of the 944 + 789.50 /2......it would be interesting
We haven't gone to the 789.50 but we are close......here is the chart for fun..........showing the two composites...
I agree with you Bruce. I know Steidlmayer used to trade of course, but who knows if he still does.
Dalton has claimed to trade in the past, but again I don't know to what degree he trades, or if he even still trades at all.
Don Jones does not trade. I have talked to him personally and he used to manage money a long time ago (I think he quit some time in the 80's), but he no longer trades. His interests lie in research rather than trading.
They have written some excellent material, but that doesn't mean they trade....and frankly, I am always skeptical of taking the advice of a spectator vs a veteran.
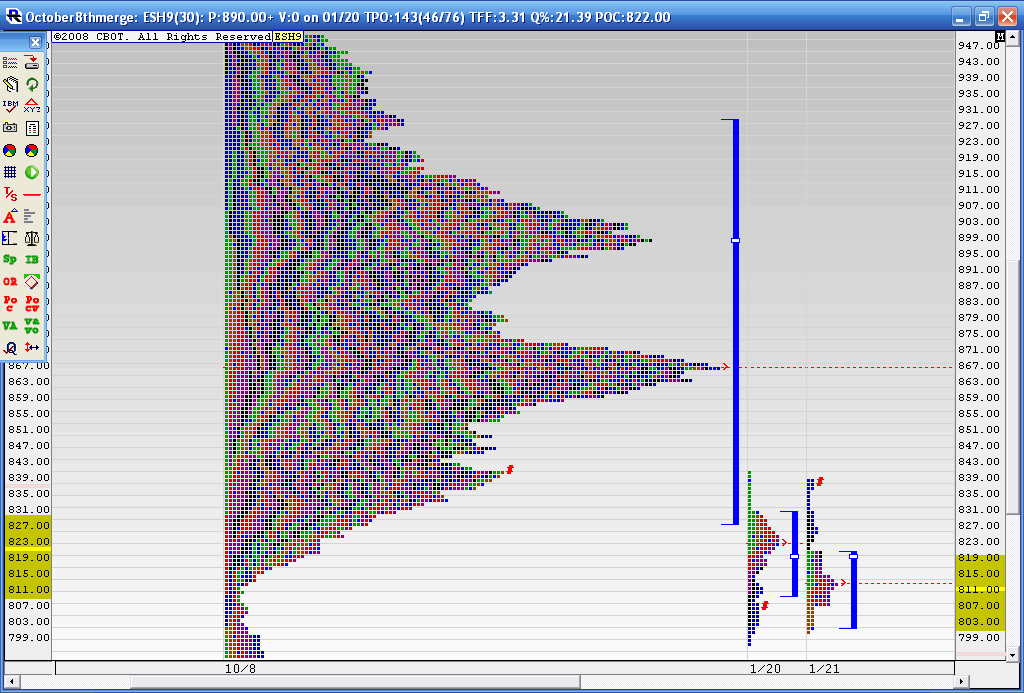
Is this the opposite of what happened when we went up into the 940 area a while back...? We get a breakout of a longer term value area but then close back inside...this time we broke out down but then reversed today into the value area and closed inside it........Is it the 80 % guideline on the daily? If it is then we should go test that high Volume node at 866 at a minimum soon.....here is the chart..
Bruce,
Hey bud one thing I wanted to mention...I have found that many of the "rules" are really iffy at this point. Almost every time you turn around there is some sort of news release that can create panic spikes all over the place.
In general, the concepts will remain valid, but always allow a little "Kentucky windage" for the craziness we are experiencing. I constantly have to remind myself of this. It can get frustrating, but it's the nature of the beast. People are in a panic and stupid people in large groups don't care if we are bracketing or not, they will drive the market parabolic at the drop of a hat in these conditions.
You obviously know your stuff bro, I just wanted to offer you some advice that I have had to come to grips with myself here recently.
Good trading, and congrats on the upcoming father thing!
Here is where we stand at the end of this week....we have formed a nice "D" shaped composite . This Chart shows the longer term composite with what happened this week. This " D" shape is what I'm looking to happen on the longer time frame....fill in those holes... The approaching week should be a real good trending week as we break out of this tight consolidation. Obviously I'm routing for the upside break out.....here is the chart.......I won't be fading breaks of the weekly highs and lows as the chances of a trend I feel are strong...just wish I knew which way....
In general if you break from a value area on any time frame you'd like to see the market move swiftly away from that value area....in this case we broke out down from the longer term but it isn't attracting a very high degree of selling...
In general if you break from a value area on any time frame you'd like to see the market move swiftly away from that value area....in this case we broke out down from the longer term but it isn't attracting a very high degree of selling...
Bottom is in for the most part.
why reaper? Curious if you have an opinion or ideas different then what I'm monitoring here...
Thanks
Thanks
Bruce, i wonder if it exceeds the 866 area and carries all the way to the 883 area to fill in that low spot between the 'mountains'? Im a newbie to market profile ,but ive noticed a tendancy for this to happen often!
We had a break out up on yesterdays high Volume fed announcement.....now we need to see if we can attract Volume above...my feeling is that they will fail on this breakout and we will get daily closes back below 867.....Sure hope I'm wrong for the longer term players like myself....I'll get a chart later
Emini Day Trading /
Daily Notes /
Forecast /
Economic Events /
Search /
Terms and Conditions /
Disclaimer /
Books /
Online Books /
Site Map /
Contact /
Privacy Policy /
Links /
About /
Day Trading Forum /
Investment Calculators /
Pivot Point Calculator /
Market Profile Generator /
Fibonacci Calculator /
Mailing List /
Advertise Here /
Articles /
Financial Terms /
Brokers /
Software /
Holidays /
Stock Split Calendar /
Mortgage Calculator /
Donate
Copyright © 2004-2023, MyPivots. All rights reserved.
Copyright © 2004-2023, MyPivots. All rights reserved.
