Merged Profile
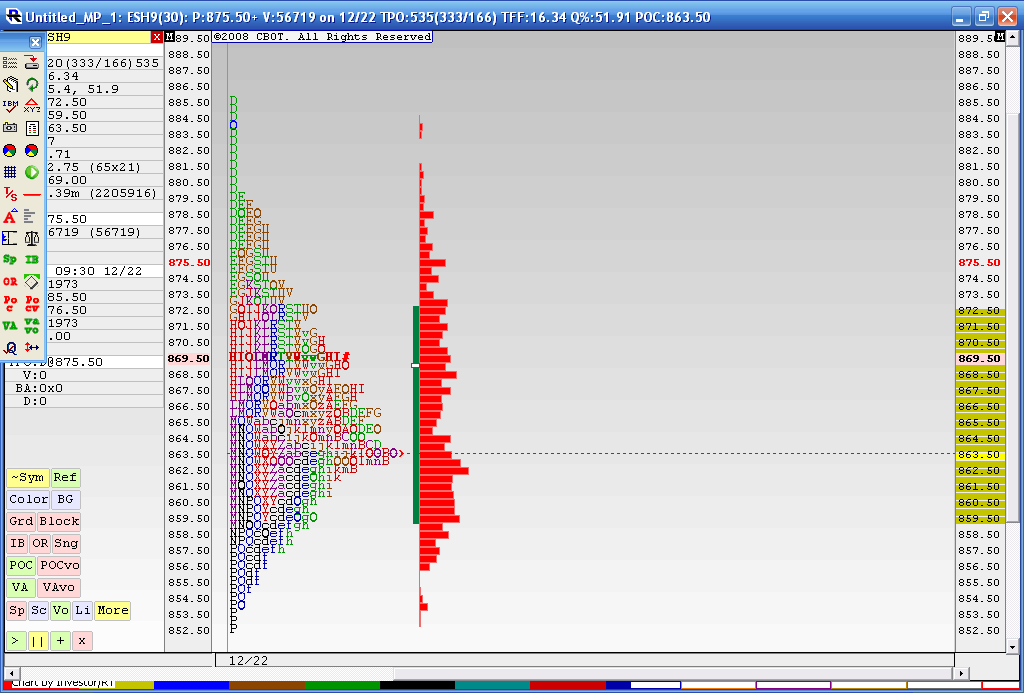
Below is the result from a 4 day merged profile as this is where we most recently have consolidated during holiday trade. The Value area high of this merge is 872.50 and the Value area low is 59.50. You may also notice that the 863.50 price has had the most trade through so far. This chart doesn't include today's trading. I think that 59.50 - 63.50 is the area we need to beat for any upside to take hold as we have the Va low and that Volume node. Current overnight high is 73.50 so it was fairly close to the merged VA high of 72.50.
In today's trading we have single prints created to the downside and through that high volume node. I'm skeptical because of the holidays and low volume but as most know we will trend many times after consolidations. I'm not sure if this counts. Anyway it's been fun firing up the old MP software for a change.
To make a long story longer: That 859.50 - 863.50 is the critical zone to watch.
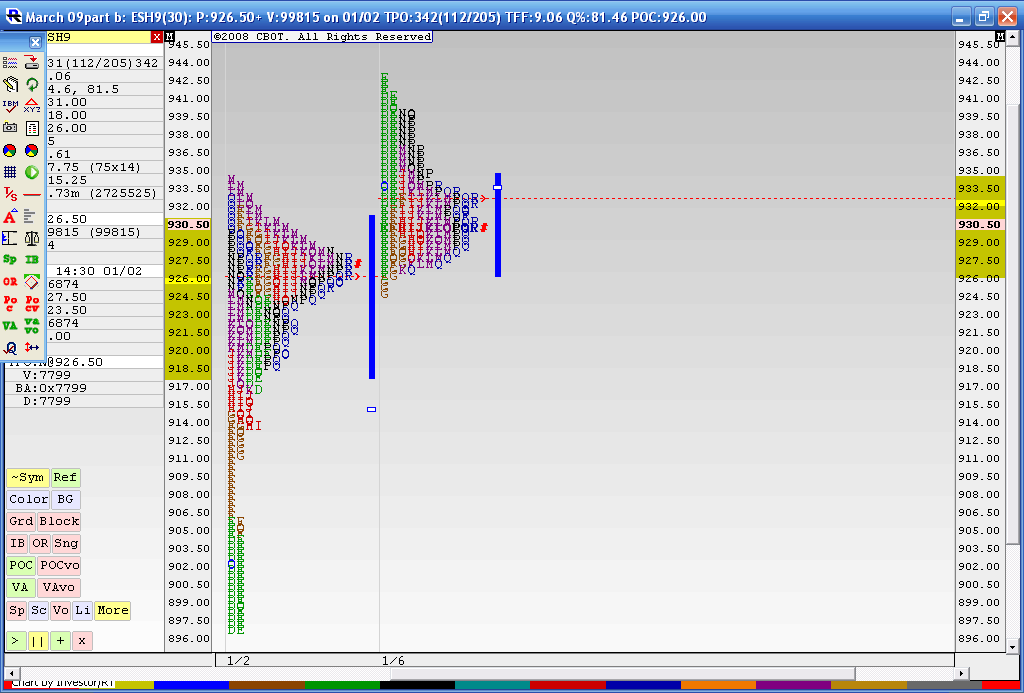
Here is how we ended up today. You will note that we drove out of the Composite but then closed back inside it. Does this sound like we could apply the 80% rule concept to this? Ok we know that 80% doesn't really happen 8 out of 10 times....but we can't deny the fact that we drove out of the value area ( of the two day composite) and then had a daily close back inside.....so the theory here would be that we will travel to the other side of value and the composite...
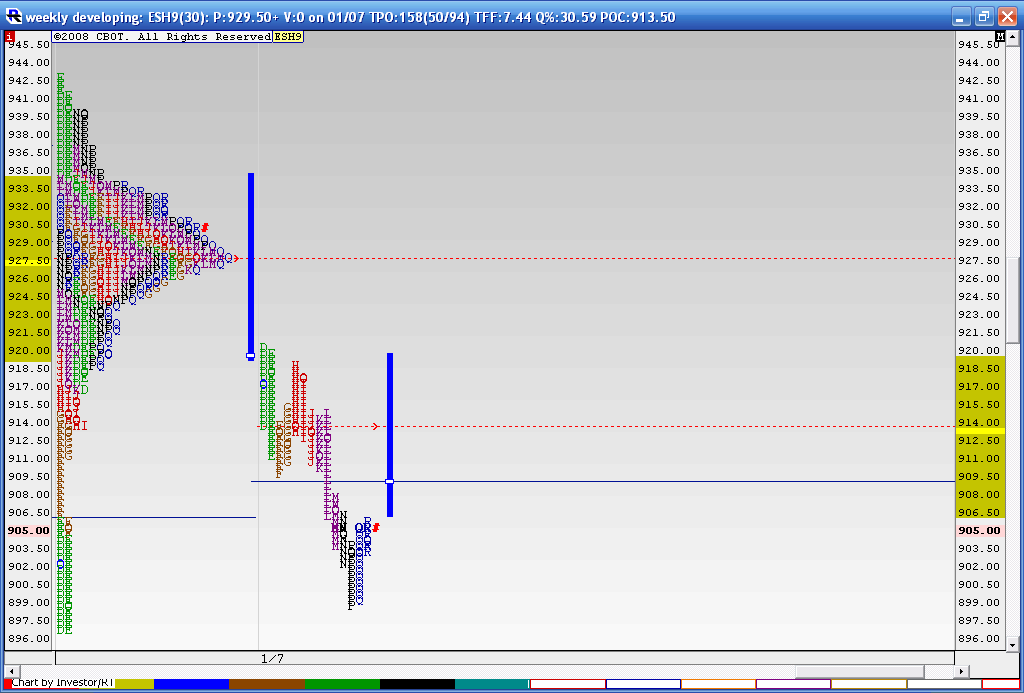
Here is the chart...Now that we traded a MOnday and a Tuesday we can calculate the 50 % and 100% of the weekly IB extended off a break of the MOnday and tuesday range....I'd like to see lower trading to fill in the holes in the composite. I'll post a cash chart for that...here are the ESH9's
Here is the chart...Now that we traded a MOnday and a Tuesday we can calculate the 50 % and 100% of the weekly IB extended off a break of the MOnday and tuesday range....I'd like to see lower trading to fill in the holes in the composite. I'll post a cash chart for that...here are the ESH9's
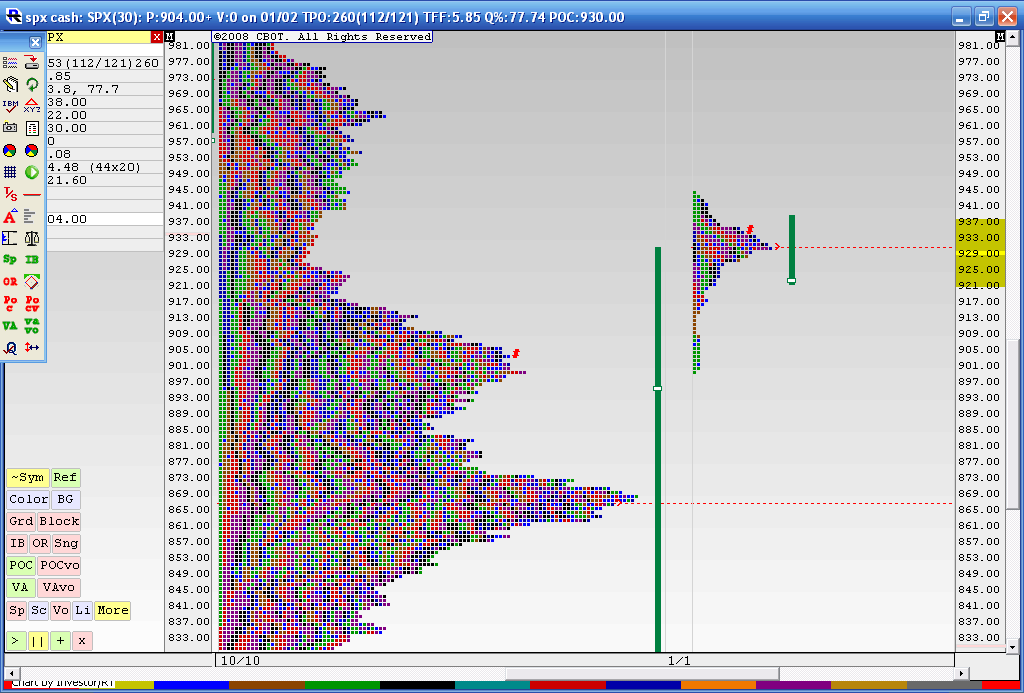
Here is how the cash is filling out ...you will notice that we are filling in a low volume area from the approximate 920 - 945 area...(PT emini refered to this concept yesterday)....of the bigger composite. To the right of the longer term composite is the 3 day "balance area"...this includes Friday , Monday and Tuesdays trade).you can see the letter 'P' in the formation.......Will lower prices follow soon? I'm not sure but the theory would state that we may rally or break down from a high volume ( the longest group of letters) node and try and fill in the composite. IN this case I anticipate a downside move. This would be part of the Step 4 ole Pete S. refers to. An attempt at a regression to the mean.
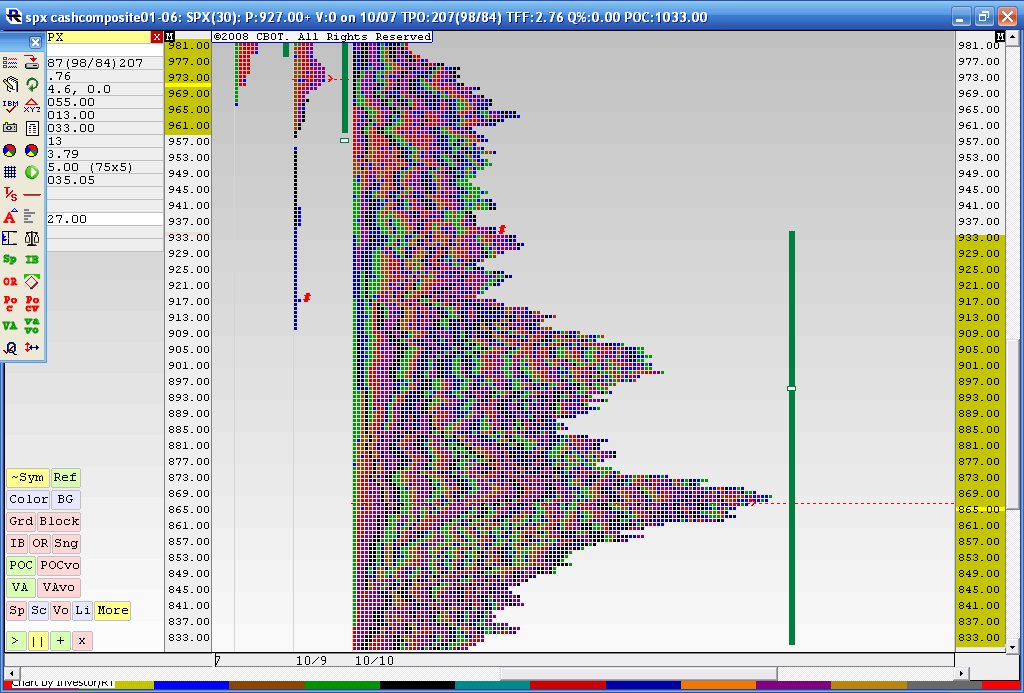
here is how it looks when I merge the last three days trading into the longer term cash composite. You can see how we filled in the low volume area up into the 944 area
with a Monday - Tuesday range of 27 points (943 high minus 916 low) we can attempt to project the weekly high or low once the Mon - Tuesday range is broken on one side. We can project using 100% and 50% of the Weekly IB range.
13.5 points is half the Weekly IB if we subtract that number from the current weekly low it projects down to the weekly pivot number in the 903 area....then a full range would be down into the 890 area.
A break of the range to the upside targets 956 and then 969 area as targets......
13.5 points is half the Weekly IB if we subtract that number from the current weekly low it projects down to the weekly pivot number in the 903 area....then a full range would be down into the 890 area.
A break of the range to the upside targets 956 and then 969 area as targets......
quote:
Originally posted by BruceM
with a Monday - Tuesday range of 27 points (943 high minus 916 low) we can attempt to project the weekly high or low once the Mon - Tuesday range is broken on one side. We can project using 100% and 50% of the Weekly IB range.
13.5 points is half the Weekly IB if we subtract that number from the current weekly low it projects down to the weekly pivot number in the 903 area....then a full range would be down into the 890 area.
Great call bruce...We broke down out of the weekly Initial Balance's you gotta love those IB's. I have for weeks been buying right ITM options in the direction of the weekly break and selling at 3points or Friday afternoon which ever comes first and been doing really well. You might want to run some numbers its been working really well for me since Oct.
Well we hit half of the weekly range yesterday and so far we have a RTH low of 93.75...so fairly good projection made on Tuesday night..for the 903 area and the 890's...
Here is a 3 day merged profile - Don Jones of cisco futures says that you should keep at least a three day as it points out key levels...I merged them to highlight the 'P' formation...who's to say at this point what is right or wrong...the interesting thing is that on Wednesday we rallied up into the three day merge Value area low after a gap down below the composites Value area...and sold off to hit the first weekly target....
Here is a 3 day merged profile - Don Jones of cisco futures says that you should keep at least a three day as it points out key levels...I merged them to highlight the 'P' formation...who's to say at this point what is right or wrong...the interesting thing is that on Wednesday we rallied up into the three day merge Value area low after a gap down below the composites Value area...and sold off to hit the first weekly target....
Some thing interesting about this chart is that How the 1/7 chart penetrated the 3 day VAL in the D& E or IB. Then the IB broke down Even though the market ran against me 9 points it still sold off late in the day. It is still interesting how the IB almost daily works off the longer term DVA's
yes Joe and in that "H" period we hit up into the DVAH for the current day.(1-07)..that's a classic MP trade when we get range extension to the downside.....then sell the first hit on the DVAH......a real beauty!
I'm putting this webinar link here from Alex Benjamin...AlleyB on this forum....it may help those who have an interest in MP
http://www.tradingclinic.com/oneoff/special20080606/special20080606.html
http://www.tradingclinic.com/oneoff/special20080606/special20080606.html
what I am showing below is a 4 day merged profile of last week and Fridays trading. You can see how on Friday we opened right into an area of low volume ( The "I" period)from the Monday - Thursday range and tried to get into the Value area of the composite. WE sold off very hard from here down into the 890 area and lower which was the full weekly projection. That 909 - 910 is a key area. You may also remember that zone from the begining of this thread. That 895 - 898 will be another for any rally to overtake. Here is the chart.....is anyone actually reading these?
Bruce
Bruce
We had a break out up on yesterdays high Volume fed announcement.....now we need to see if we can attract Volume above...my feeling is that they will fail on this breakout and we will get daily closes back below 867.....Sure hope I'm wrong for the longer term players like myself....I'll get a chart later
Emini Day Trading /
Daily Notes /
Forecast /
Economic Events /
Search /
Terms and Conditions /
Disclaimer /
Books /
Online Books /
Site Map /
Contact /
Privacy Policy /
Links /
About /
Day Trading Forum /
Investment Calculators /
Pivot Point Calculator /
Market Profile Generator /
Fibonacci Calculator /
Mailing List /
Advertise Here /
Articles /
Financial Terms /
Brokers /
Software /
Holidays /
Stock Split Calendar /
Mortgage Calculator /
Donate
Copyright © 2004-2023, MyPivots. All rights reserved.
Copyright © 2004-2023, MyPivots. All rights reserved.
