Merged Profile
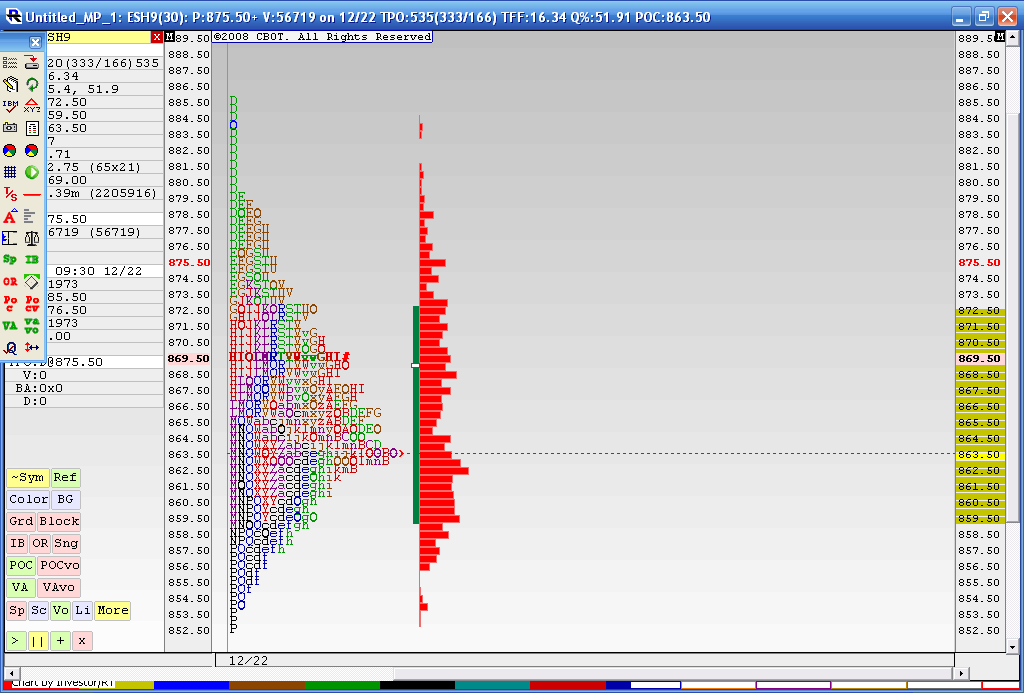
Below is the result from a 4 day merged profile as this is where we most recently have consolidated during holiday trade. The Value area high of this merge is 872.50 and the Value area low is 59.50. You may also notice that the 863.50 price has had the most trade through so far. This chart doesn't include today's trading. I think that 59.50 - 63.50 is the area we need to beat for any upside to take hold as we have the Va low and that Volume node. Current overnight high is 73.50 so it was fairly close to the merged VA high of 72.50.
In today's trading we have single prints created to the downside and through that high volume node. I'm skeptical because of the holidays and low volume but as most know we will trend many times after consolidations. I'm not sure if this counts. Anyway it's been fun firing up the old MP software for a change.
To make a long story longer: That 859.50 - 863.50 is the critical zone to watch.
Thanks Bruce for the chart and your commentary. They are always helpful.
It looks that (for the moment) sellers cannot sustain a break below the POC area of the last 4 weeks. The Trin has swung from bearish to bullish. It's beginning to look as though the low for the Day may possibly be in.
Take care.
It looks that (for the moment) sellers cannot sustain a break below the POC area of the last 4 weeks. The Trin has swung from bearish to bullish. It's beginning to look as though the low for the Day may possibly be in.
Take care.
The pull back off the high is on reduced volume so I would hope we can still make it to the POC for the day if not the VAH.
Nq ( edit : and YM)has double TPO's on lows....YM and NQ have no break of hour highs or open print..( ES did)..so I can't get long up here....my bias is short..but no doubt we have a confused market and I am a confused trader up here..lowest range 15 minute bar at the highs...I need more evidence of this up move for long side......thanks for the chart
I see 817.50 as a SAR level.
all markets seem to be accepting price below yesterdays RTH lows....should go get those double tpo's soon
the consolidation continues...we know the big move is coming but which way ? We can't rule out a move to try for the 866 high volume......lots of folks want the retrace down but we aren't rallying or selling off very well.....hopefully Thursday will be a big day before good Friday..I'm on the lookout for the breakout trade
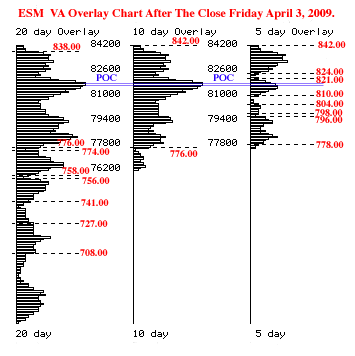
As ever narrow ranges give way to big breakout moves. The trend of the daily POC for the last 5 sessions is down suggesting a down side break. However to bring in another entirely unrelated methodology - Elliott wave analysis - suggests that we are likely to break higher in a final wave up from the low 8 sessions ago. The projected high is in the 850.00 area. This incidentally could well be the bear market rally high.
Well they blew out 850.00 at the NYSE close. So the next logical up side target is Bruce's high volume target 866.00. But after the holiday weekend I guess.
Happy Easter everyone.
Happy Easter everyone.
Same to you DW and great call on the 850..!
quote:
Originally posted by dafydd
Well they blew out 850.00 at the NYSE close. So the next logical up side target is Bruce's high volume target 866.00. But after the holiday weekend I guess.
Happy Easter everyone.
We had a break out up on yesterdays high Volume fed announcement.....now we need to see if we can attract Volume above...my feeling is that they will fail on this breakout and we will get daily closes back below 867.....Sure hope I'm wrong for the longer term players like myself....I'll get a chart later
Emini Day Trading /
Daily Notes /
Forecast /
Economic Events /
Search /
Terms and Conditions /
Disclaimer /
Books /
Online Books /
Site Map /
Contact /
Privacy Policy /
Links /
About /
Day Trading Forum /
Investment Calculators /
Pivot Point Calculator /
Market Profile Generator /
Fibonacci Calculator /
Mailing List /
Advertise Here /
Articles /
Financial Terms /
Brokers /
Software /
Holidays /
Stock Split Calendar /
Mortgage Calculator /
Donate
Copyright © 2004-2023, MyPivots. All rights reserved.
Copyright © 2004-2023, MyPivots. All rights reserved.

