Merged Profile
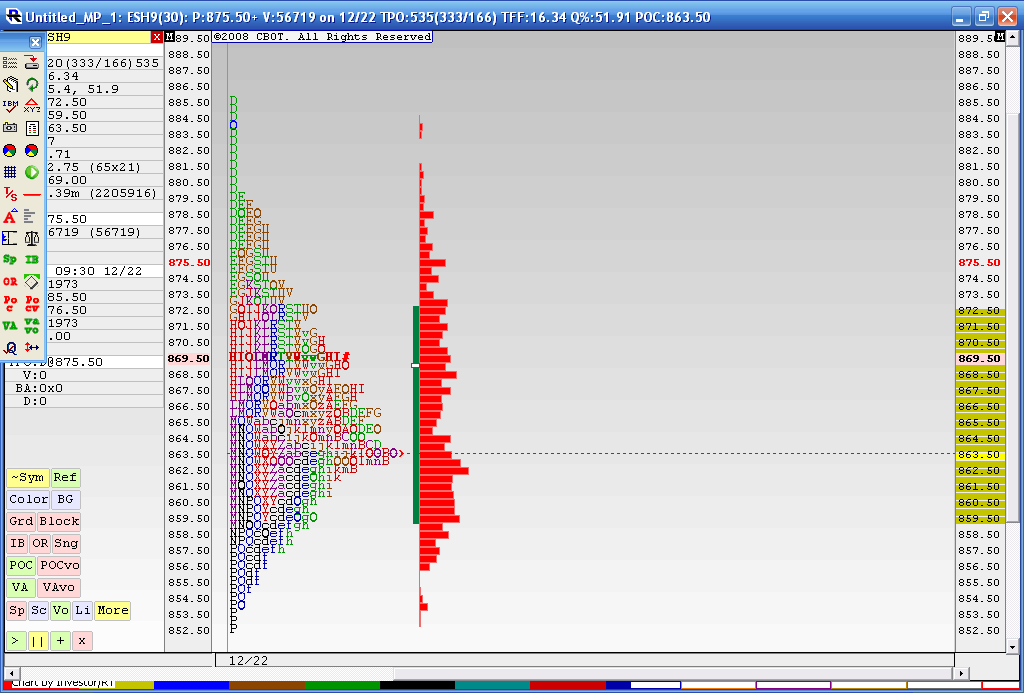
Below is the result from a 4 day merged profile as this is where we most recently have consolidated during holiday trade. The Value area high of this merge is 872.50 and the Value area low is 59.50. You may also notice that the 863.50 price has had the most trade through so far. This chart doesn't include today's trading. I think that 59.50 - 63.50 is the area we need to beat for any upside to take hold as we have the Va low and that Volume node. Current overnight high is 73.50 so it was fairly close to the merged VA high of 72.50.
In today's trading we have single prints created to the downside and through that high volume node. I'm skeptical because of the holidays and low volume but as most know we will trend many times after consolidations. I'm not sure if this counts. Anyway it's been fun firing up the old MP software for a change.
To make a long story longer: That 859.50 - 863.50 is the critical zone to watch.
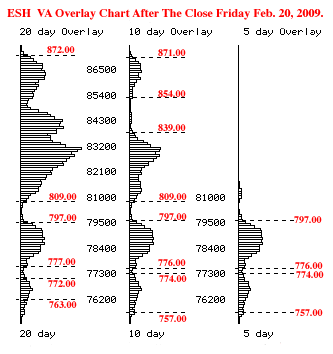
Today and the past week is a reminder that Over Sold (OS) can become more OS. Coming into this week an Overlay chart gives us some good numbers and distributionds to watch. We are now trading at the VAL of the past 5 and 10 days with a TRIN a bullish 60. Could reversal be near?
well we hit the 48-50 projection but so far I'm not seeing some incredible buying interest....double TPO's on the lows leads me to believe that the downmove isn't over yet today...we need to see some excess and matching tpo's on lows doesn't show this
quote:
Originally posted by BruceM
further downside will target the 748 - 750......BUT if we look at the gap and the last two days trade we get the 'b' pattern........and it sure does seem like "secret " buying has taken place to go retest up to the 806 - 812 area...
this would get us to 50% of a weekly IB target........hopefully we'll get some good clues after we open today
I'd like to see 43 - 46 stop the downward spiral and form a buying tail off that area/////wishful thinking perhaps
I'm thinking 31-35 is where we're likely to get a buying tail.
tail has always been hard to predict
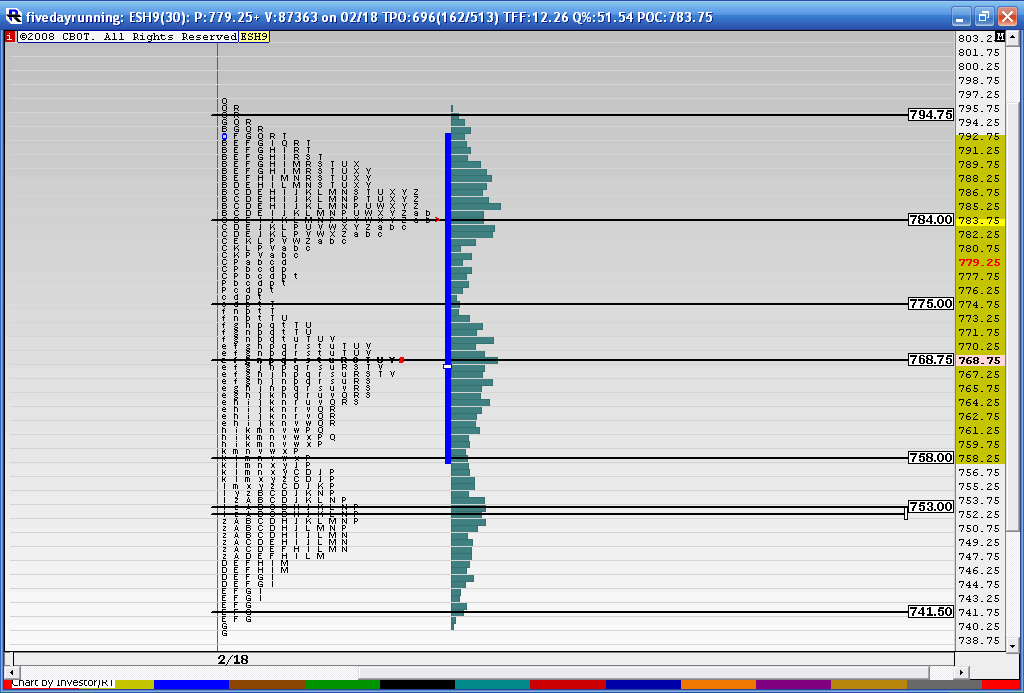
Here are the key areas from the rolling 5 day profile:
$ ticks closing unusually high and trin at very low levels...seems like upside from the closing levels will be limited. Seems like the 58 area from today is a magnet price.
$ ticks closing unusually high and trin at very low levels...seems like upside from the closing levels will be limited. Seems like the 58 area from today is a magnet price.
Bruce I think you are probably right. Yesterday's buying appears to have been primarily short covering. If there is no follow through buying today - buyers buying the unfair high - I expect we will have a rotational day. An inside day between 753.00 - 772.00 would not be surprising.
Bruce; 757 is square of 9; that go well with your 758
Thanks Red...I've been firing up daily Volume profiles and the Volume Value area numbers from yesterdays trade come in as follows:
VA HIGH - 773.75
POC - 771
VA LOw - 751.50
So then I try to factor that in with the bigger picture and then I try to make good trades.....Having that 758 near last weeks low is another plus....weekly Pivot hasn't been hit up at 780 and we need to break out of the MOn-Tuesday range at some point...hopefully on the upside.... now that they have relieved some of that high $tick and TRin readings from yesterdays close they still have a chance at it soon
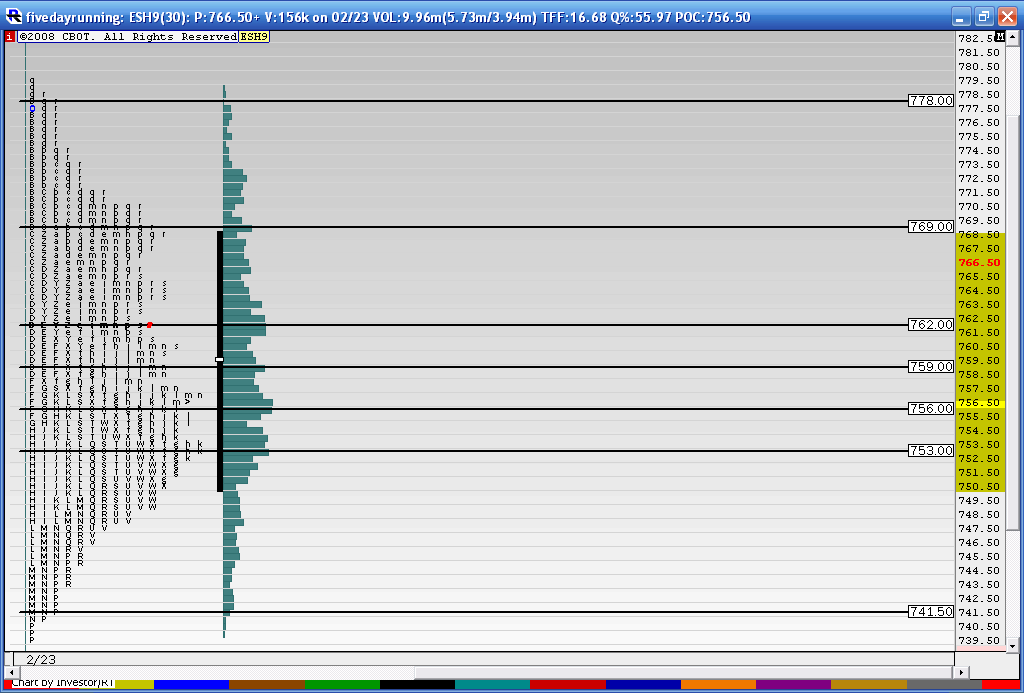
here is the consolidation from the past three days......we also have yesterdays Volume VA which is
764.75
756.75
753.75
I think the two critical zones to watch in RTH will be
764-769 and 754 - 757
approximate 40 point range so far this week so the breakout targets from this range will be 20 and 40 points above/below breakout points.
Could see the 800 area on a good break......monthly targets to downside have already hit so up is a good choice
We had a break out up on yesterdays high Volume fed announcement.....now we need to see if we can attract Volume above...my feeling is that they will fail on this breakout and we will get daily closes back below 867.....Sure hope I'm wrong for the longer term players like myself....I'll get a chart later
Emini Day Trading /
Daily Notes /
Forecast /
Economic Events /
Search /
Terms and Conditions /
Disclaimer /
Books /
Online Books /
Site Map /
Contact /
Privacy Policy /
Links /
About /
Day Trading Forum /
Investment Calculators /
Pivot Point Calculator /
Market Profile Generator /
Fibonacci Calculator /
Mailing List /
Advertise Here /
Articles /
Financial Terms /
Brokers /
Software /
Holidays /
Stock Split Calendar /
Mortgage Calculator /
Donate
Copyright © 2004-2023, MyPivots. All rights reserved.
Copyright © 2004-2023, MyPivots. All rights reserved.


