Merged Profile
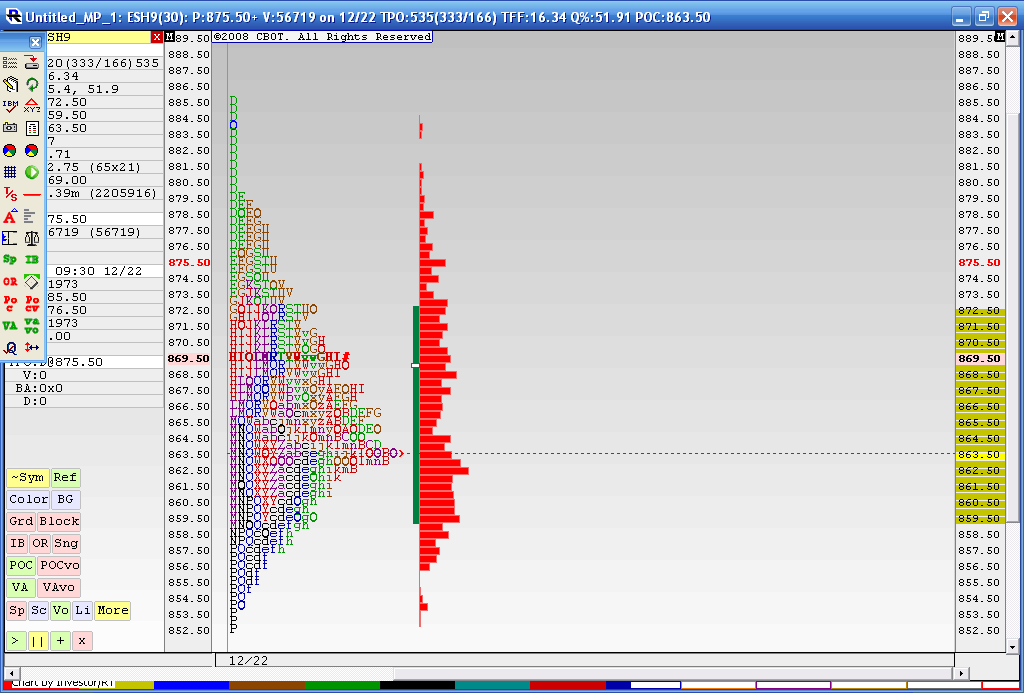
Below is the result from a 4 day merged profile as this is where we most recently have consolidated during holiday trade. The Value area high of this merge is 872.50 and the Value area low is 59.50. You may also notice that the 863.50 price has had the most trade through so far. This chart doesn't include today's trading. I think that 59.50 - 63.50 is the area we need to beat for any upside to take hold as we have the Va low and that Volume node. Current overnight high is 73.50 so it was fairly close to the merged VA high of 72.50.
In today's trading we have single prints created to the downside and through that high volume node. I'm skeptical because of the holidays and low volume but as most know we will trend many times after consolidations. I'm not sure if this counts. Anyway it's been fun firing up the old MP software for a change.
To make a long story longer: That 859.50 - 863.50 is the critical zone to watch.
What do I know?There are negative divergences as we break higher. If bulls sustain this grind higher there is no significant volume at price resistance until we get to the 824 - 825 area.
certainly close enough......the monthly projections came in up here too......overlapping value today.....but is this just a pause...? My gut feeling is they want to retest the 781's and the 760's and soon......percentage wise the Dow was down the least today which leads me to believe that the selling isn't over yet...so I'm leaning short....Hey Kool...when are those high $Ticks gonna kick in for those of us with the short side glasses on?
quote:
Originally posted by dafydd
What do I know?There are negative divergences as we break higher. If bulls sustain this grind higher there is no significant volume at price resistance until we get to the 824 - 825 area.
already started, friend
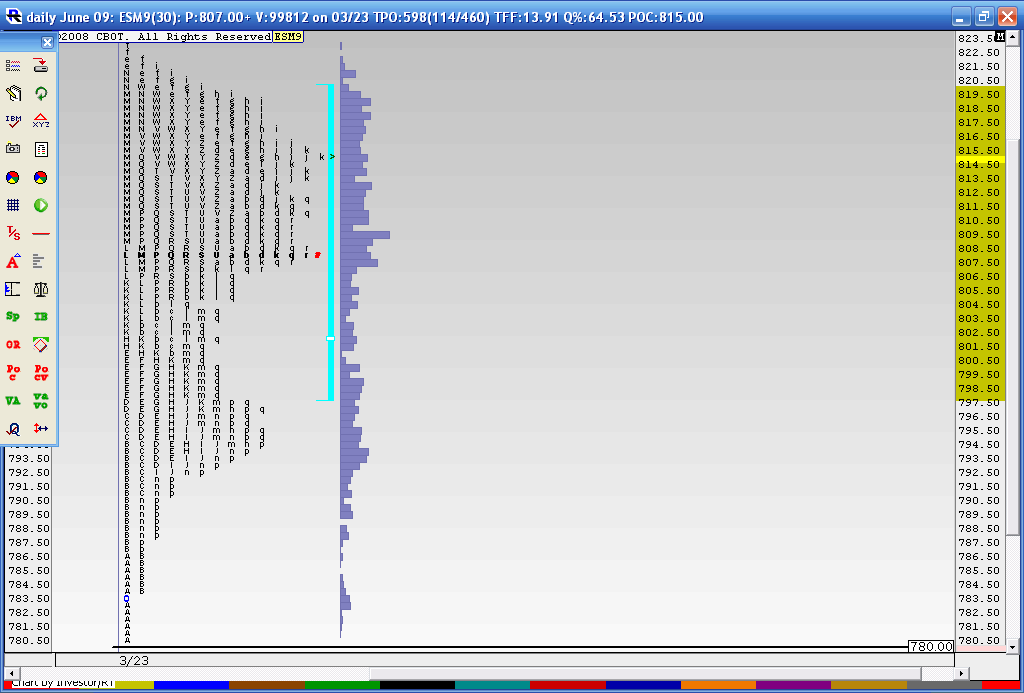
here is the 3 day merged profile. 809 is the high volume node as per regular volume and 814 high volume based on price....it looks to me that they may want to fill in the lower part but my read on these is shaky....
Today hit support exactly at the single prints created from mondays trade.....so if that buying is true then new highs are coming......obviously I have conflicting ideas coming into the thursday / Friday time frame...the profile wants lower but those single prints ignited some good buying today.....
If the singles get traded to again tomorrow then we should see a good selloff and a retest of the 766 area soon
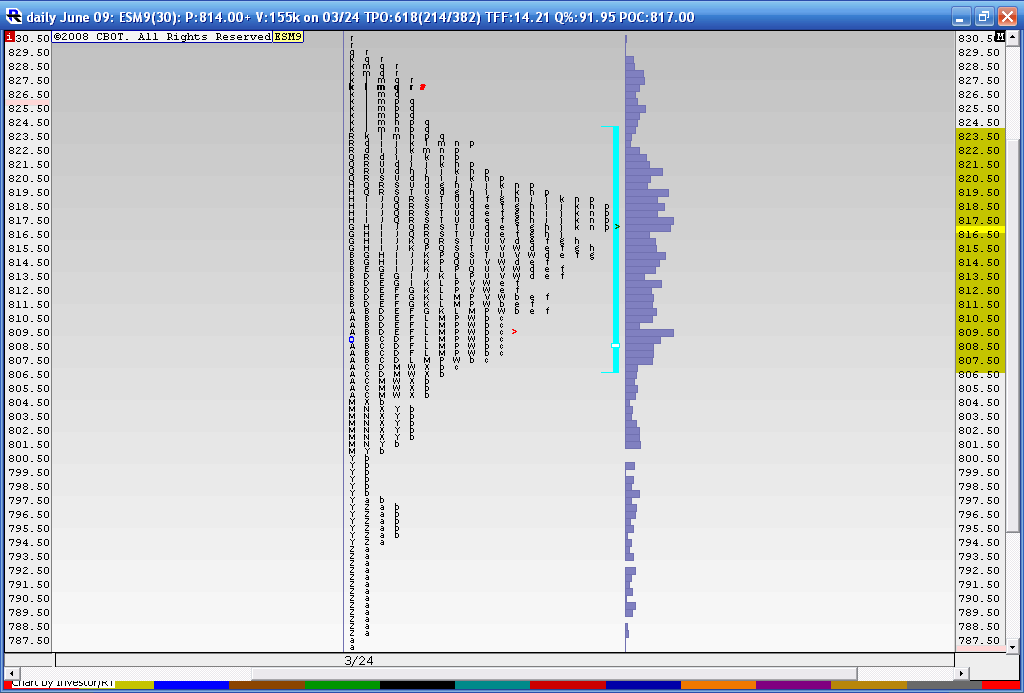
Big volume at 815 - 817 today and the 800 area
well we barely etched out new highs today.......seems like somebody is laying into shorts up here......here is the last three days.....817 - 819 is the key price zone for shorts to win over then the 809...
The market does not seem to aprove of GM - Goverment Motors.
Today was proving to be a test of one of my favorite openings - 'three connsecutive five minute bars, all lower (or higher) and at least one a wide range bar. This is usually one of the few day where you can buy/sell the fifteen minute high/low and hold until the close (or 4.00 p.m. EST)'.
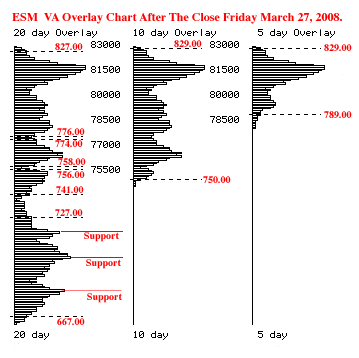
As we break lower here is the current VA Overlay chart to guide us at the potential support areas below. Obviously 750.00 will be big. A failure there would open the doors to a possible test of the low as the G20 grinds on.
------------------------------------------------------------------------
I used your 15 minute filter today D.W so thanks for that...I covered down into the 81's though which may be a mistake....those single prints have been accepted at the 787 area so that may be good for shorts....I still can't help get the feeling that this down move in labored today....
I'd be much more comfortable holding shorts if Naz and Russel could show more weakness...and what is with all these $tick divergences......those really suck sometimes....meaning they are useless...!!!
quote:
Originally posted by BruceM
I used your 15 minute filter today D.W so thanks for that...I covered down into the 81's though which may be a mistake....those single prints have been accepted at the 787 area so that may be good for shorts....I still can't help get the feeling that this down move in labored today....
That particular 15 minute filter is good, but one is lucky to get it 3 or 4 times a month. It has a 65% chance of closing at or close to the low of the day. Today the single print at 775.50 was the heads up to cover. The 5 minute OBV closely followed with the cover alert.. If one trades multiple contracts one could consider trading a fraction to the close or a single print heads up. Notice we traded down to the VAL of the upper 20 day overlay distribution. You've got to love the MP VA numbers.
I'm hoping to get a chart up later that shows todays "b" profile pattern forming against a longer term 'P' profile......Dalton says that buying in the lower portion of a "p" profile can be a good trade so I'm wondering if the buyers where trying to take control in a subtle way during the day session......Trciky and we'll need more info from tomorrows trade
We had a break out up on yesterdays high Volume fed announcement.....now we need to see if we can attract Volume above...my feeling is that they will fail on this breakout and we will get daily closes back below 867.....Sure hope I'm wrong for the longer term players like myself....I'll get a chart later
Emini Day Trading /
Daily Notes /
Forecast /
Economic Events /
Search /
Terms and Conditions /
Disclaimer /
Books /
Online Books /
Site Map /
Contact /
Privacy Policy /
Links /
About /
Day Trading Forum /
Investment Calculators /
Pivot Point Calculator /
Market Profile Generator /
Fibonacci Calculator /
Mailing List /
Advertise Here /
Articles /
Financial Terms /
Brokers /
Software /
Holidays /
Stock Split Calendar /
Mortgage Calculator /
Donate
Copyright © 2004-2023, MyPivots. All rights reserved.
Copyright © 2004-2023, MyPivots. All rights reserved.


