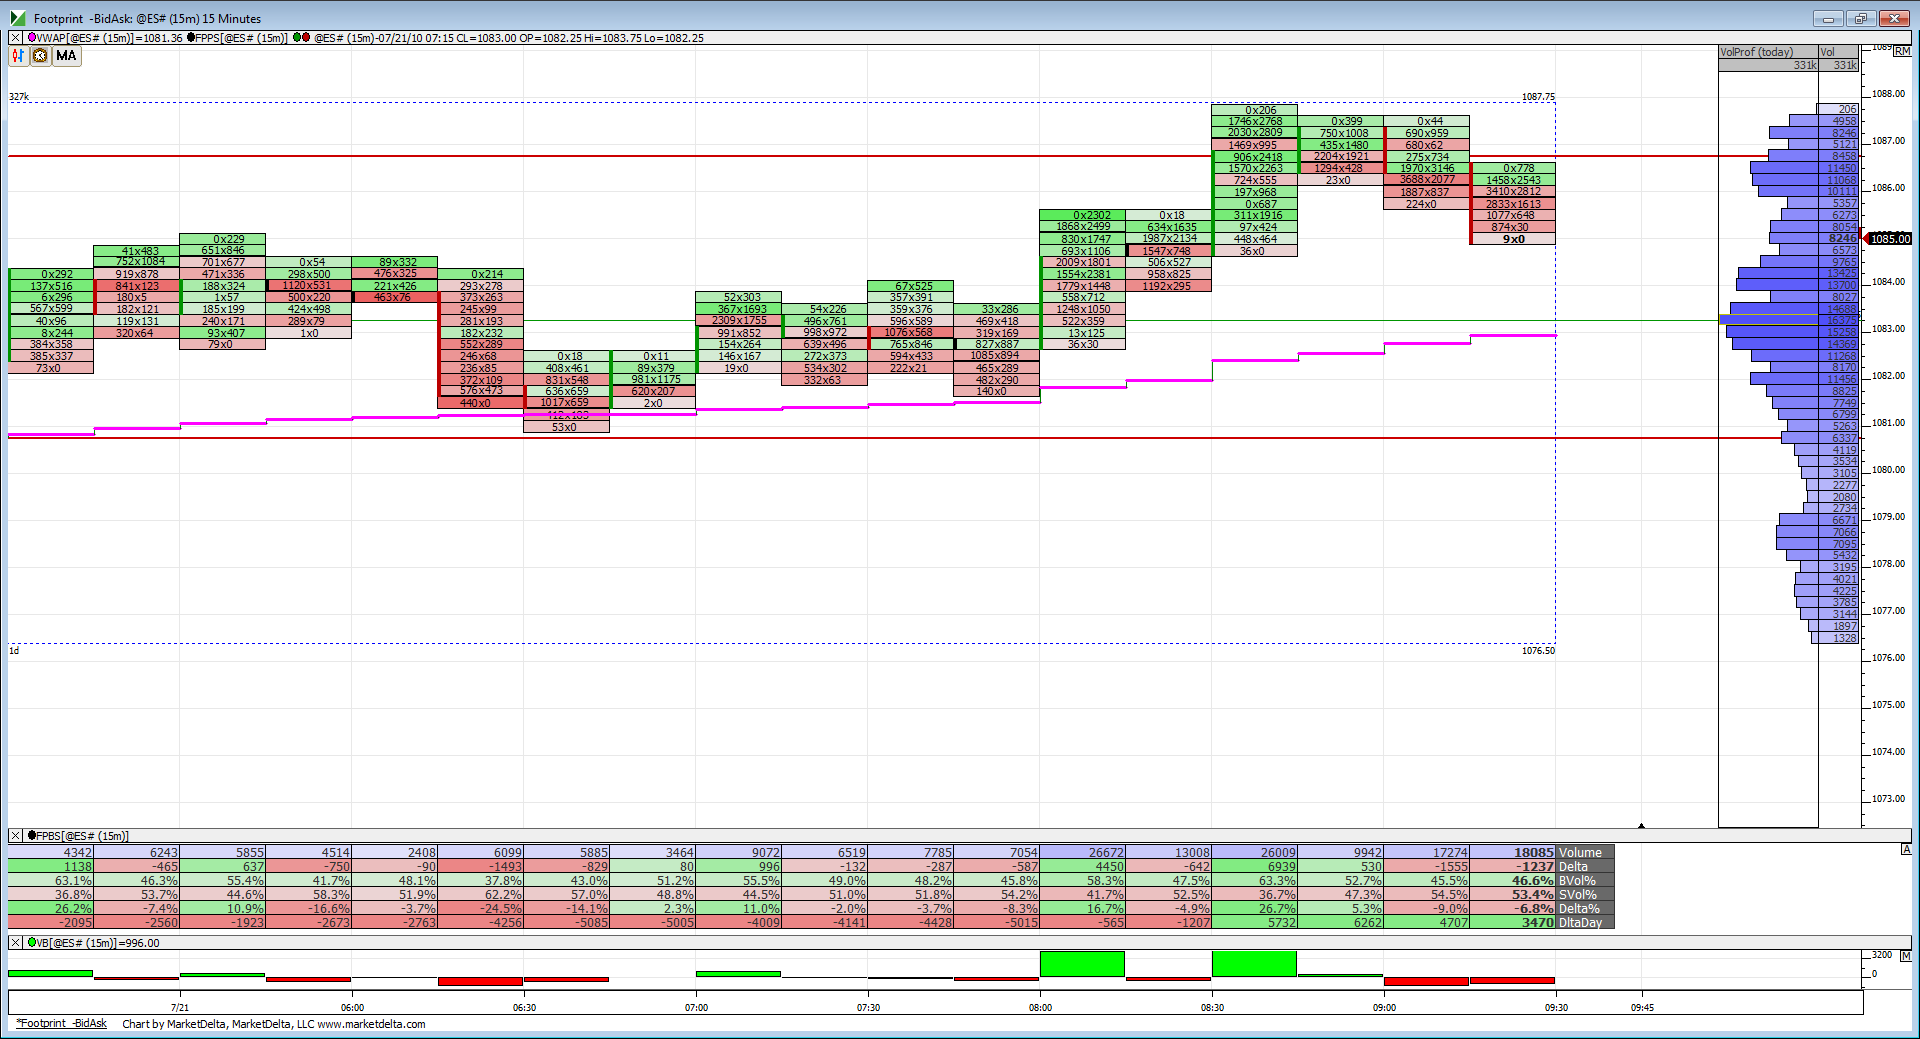
ES short term trading 7-21-10
Here are the zones I'm watching
1101 is low volume based on composite work
90.50 - 93 ***** HV area from the composite
85 - 86 - Fridays high and POC from Thursday
80 - 81 Tuesdays high and volume node
70 - 73 ************ key support, high volume , Va high ---Bold intentional
66 **** single prints
61.50*** High volume
56.50 ****high volume
My plan will be to sell rallies with high $ticks...especially if we gap up in RTH into one of our two key zones above today's highs....we know what usually happens after trend days
Will try to take one off at 1085.50, and hold the runner for a bit...
Originally posted by phileo
Upon reviewing the daily chart, one thing stood out for me as a potential trade of the day: any breakout rally thru 1084, or any initiative rally that occurs above 1084 will likely bring in the daily time frame traders for a long targetting 1088 VPOC and possibly even 1090.75 gap fill.
It's structured the same way as today's breakout of 1066 implied a move targetting 1070 prior support and extended target 1074 VPOC.
dang, they took away that trade in the PreMkt. 1084-1087.75.
Off by a tick, sorry folks, I'll try to do better next time.
one off at 1085.580..plus 1.75 holding for 84 on the other
nice start...out 1084 on the other...plus 3.25
flat at 80.25 print....I'm a bad buyer so hoping to sell higher up with high $ticks
Originally posted by BruceMwell done,Bruce, nice recovery.. but how can you hold from 83 up to nearly 88? where would you have cried uncle?
flat at 80.25 print....I'm a bad buyer so hoping to sell higher up with high $ticks
your chart shows the nice low volume zone and hence the area of my initial target on the poor On initiation...that was my final exit area though....and so close to the gap fill...butthe point being that the low volume in O/N and midrange gets tested from O/N.....A lot !!
Everything in context though.......last friday for example...we would have been crushed!! INSTEAD OF CRUSHING THEM!! WHERE ARE MY DANG BLASTED HIGH $TICKS...? hA!
Everything in context though.......last friday for example...we would have been crushed!! INSTEAD OF CRUSHING THEM!! WHERE ARE MY DANG BLASTED HIGH $TICKS...? hA!
Originally posted by Lorn
As per Bruce here is a snapshot of O/N trade.
as per earlier posts..76 gets me long as hell
Originally posted by koolblue
Originally posted by BruceMwell done,Bruce, nice recovery.. but how can you hold from 83 up to nearly 88? where would you have cried uncle?
flat at 80.25 print....I'm a bad buyer so hoping to sell higher up with high $ticks
I agree. It would have been tortuous for me to hold thru 4.5pts of heat. Why not bail on that breakout of 1085.5, and re-short at higher levels?
Sounds interesting to me Phileo - looking forward to it.
Emini Day Trading /
Daily Notes /
Forecast /
Economic Events /
Search /
Terms and Conditions /
Disclaimer /
Books /
Online Books /
Site Map /
Contact /
Privacy Policy /
Links /
About /
Day Trading Forum /
Investment Calculators /
Pivot Point Calculator /
Market Profile Generator /
Fibonacci Calculator /
Mailing List /
Advertise Here /
Articles /
Financial Terms /
Brokers /
Software /
Holidays /
Stock Split Calendar /
Mortgage Calculator /
Donate
Copyright © 2004-2023, MyPivots. All rights reserved.
Copyright © 2004-2023, MyPivots. All rights reserved.
