ES short term trading 7-21-10
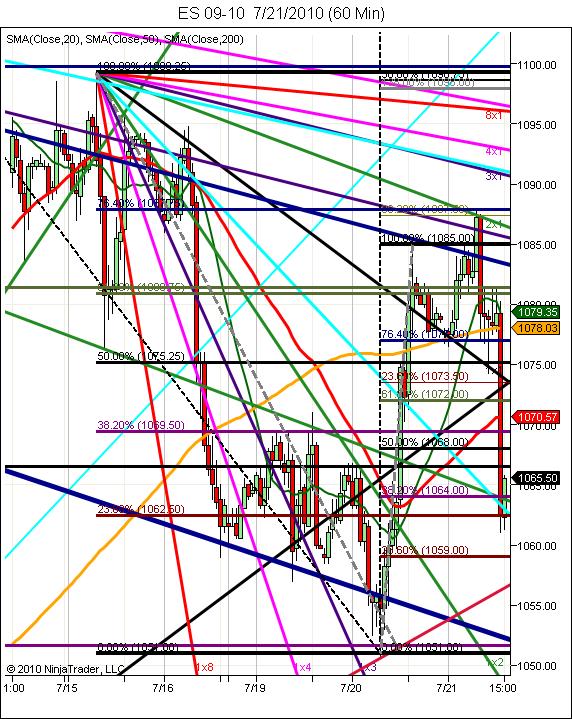
Here are the zones I'm watching
1101 is low volume based on composite work
90.50 - 93 ***** HV area from the composite
85 - 86 - Fridays high and POC from Thursday
80 - 81 Tuesdays high and volume node
70 - 73 ************ key support, high volume , Va high ---Bold intentional
66 **** single prints
61.50*** High volume
56.50 ****high volume
My plan will be to sell rallies with high $ticks...especially if we gap up in RTH into one of our two key zones above today's highs....we know what usually happens after trend days
Kool. nice job.
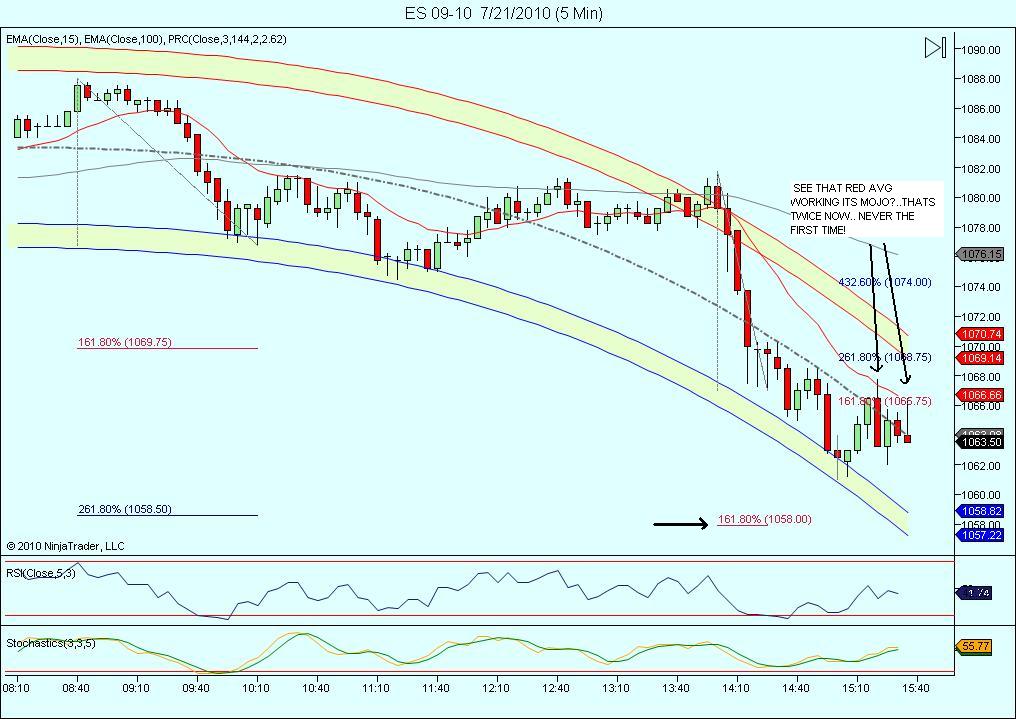
I saw 66.25 on the 5 minute.
...should I be scaling down to the 1 minute after I get a 5 minute projection, and look for another projection on the 1 minute that's in the same area?
I mainly look at and trade off the 5 minute.
Any guidance would be great.
I saw 66.25 on the 5 minute.
...should I be scaling down to the 1 minute after I get a 5 minute projection, and look for another projection on the 1 minute that's in the same area?
I mainly look at and trade off the 5 minute.
Any guidance would be great.
I ALWAYS GO TO THE 0NE MINUTE AFTER I MAKE A DECISION BASED O/N THE 5 MIN, YES! it is generally more accurate!
note that the 4.236 on the one min was 1067.50 and the red avg was 1067.33 on the 5 min so i knew there had to be some resistance there... my exit , being honest was pure luck...
Originally posted by BruceM
Phileo aka " the $tick master" How about starting a thread on the $ticks and teach us your tricks...so maybe a few of us can stop beating our heads against the wall with them...
Bruce, I am no master, as everyone can plainly see, I only got 1pt out of that 6pt trade setup.
See my latest post, and let me know if that answers your questions.
many feel that you need to see two TPO.s inside value to make it accepted...that doesn't really help but the fact that we are building time and value under YD's VA high and that we erased all single prints in theroy should lead to a test of YD's low....sorry I can't help more
You obviously don't want trade to come back out of Va highs if you were short from above and got below the VA high...in other words....don't come back out of value again ..once you enter
You obviously don't want trade to come back out of Va highs if you were short from above and got below the VA high...in other words....don't come back out of value again ..once you enter
Originally posted by sjzeno
when the vah got broken to the downside. does anyone go short and hold for the val? does anyone know the statistics of this happening?
3rd higher low hourly
all ya got except for the crimson uptrend and yesterdays 50% retrace level. Under all other 50% retrace levels here, horizontal and diagonal(crossed black lines). Got to run, be careful if bold. Not liking em today. Don't think they'll outrun you if a bottom. Plenty of R levels. Down would be the express.
Dual fib lines. hmmm.
Gotta run. Have a good close.
Originally posted by phileo
Originally posted by Lorn
How do you define TICK exhaustion?
Divergence?
Originally posted by phileo
long 1061.25, target 1063, 1pt stop
seeing TICK exhaustion,
My own discretionary definition:
4 or more TICK extremes during a 9+ pt move, then a super TICK extreme (eg. +/- 1350 or more) into a prior S/R zone. The idea here is that last TICK extreme creates an unsustainable condition.
Note also that I've been caught trying to fade the 3rd TICK extreme. I've observed that sell programs are almost never "one and done". After 4 or more TICK extremes, the odds increase that they're "done." But the other key is that the super TICK extreme needs to occur near a prior S/R zone, in order to improve the probability even more.
Well, I'm off to the crude pits tomorrow! Wish me luck! I hope the analysis the past week or so has been useful to some ...Good trading all!!!
I think if you really want us to understand what u r trying to do David then you will have to break it down in small chunks....I'm not poking fun at your method but I couldn't imagine trading from that chart....so help me out please...you may need to start at the fundamentals of your charts as you probably know them second nature...so perhaps we can start at ground zero...even a sperate thread on the forum would be cool
Originally posted by DavidS
3rd higher low hourly
all ya got except for the crimson uptrend and yesterdays 50% retrace level. Under all other 50% retrace levels here, horizontal and diagonal(crossed black lines). Got to run, be careful if bold. Not liking em today. Don't think they'll outrun you if a bottom. Plenty of R levels. Down would be the express.
Dual fib lines. hmmm.
Gotta run. Have a good close.
Sounds interesting to me Phileo - looking forward to it.
Emini Day Trading /
Daily Notes /
Forecast /
Economic Events /
Search /
Terms and Conditions /
Disclaimer /
Books /
Online Books /
Site Map /
Contact /
Privacy Policy /
Links /
About /
Day Trading Forum /
Investment Calculators /
Pivot Point Calculator /
Market Profile Generator /
Fibonacci Calculator /
Mailing List /
Advertise Here /
Articles /
Financial Terms /
Brokers /
Software /
Holidays /
Stock Split Calendar /
Mortgage Calculator /
Donate
Copyright © 2004-2023, MyPivots. All rights reserved.
Copyright © 2004-2023, MyPivots. All rights reserved.

