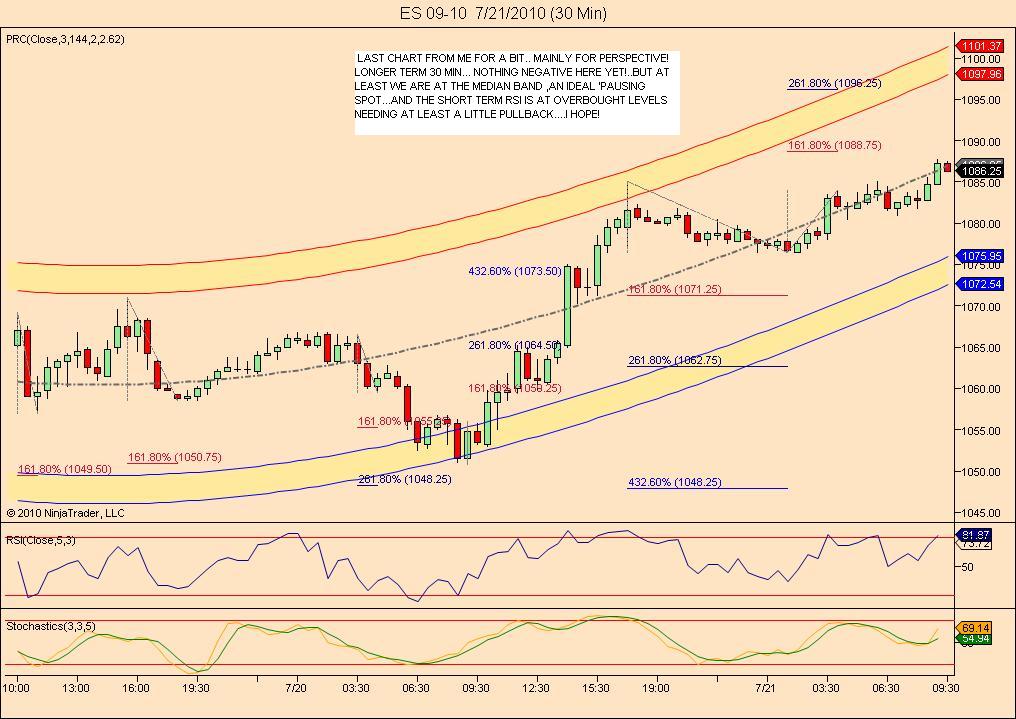
ES short term trading 7-21-10
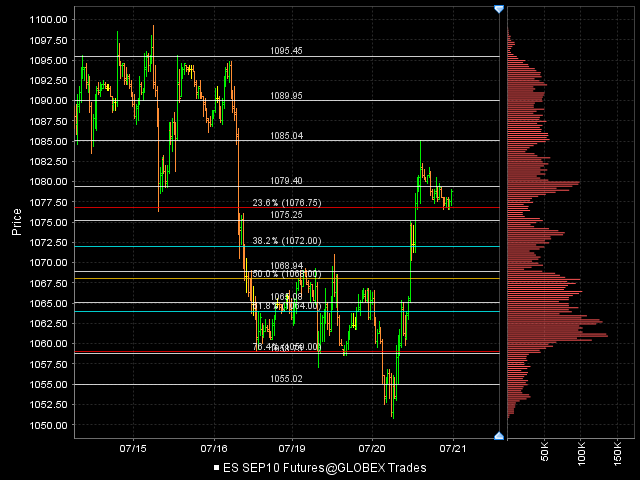
Here are the zones I'm watching
1101 is low volume based on composite work
90.50 - 93 ***** HV area from the composite
85 - 86 - Fridays high and POC from Thursday
80 - 81 Tuesdays high and volume node
70 - 73 ************ key support, high volume , Va high ---Bold intentional
66 **** single prints
61.50*** High volume
56.50 ****high volume
My plan will be to sell rallies with high $ticks...especially if we gap up in RTH into one of our two key zones above today's highs....we know what usually happens after trend days
It's MATD again, folks. AAPL delivered again with yet another earnings beat, that combined with the market climbing the wall fo worry from disappointing earnings from IBM and GS this morning should set a +ve tone tomorrow, barring any black swan news event...
MATD oscillation points:
1084-85: LVN as per Bruce's MP chart + lower end of VA from last week
1074: a couple of VPOC's + Friday support lvl + weekly PP
1070: support lvl from today (Tues) and from 7/12.
Upon reviewing the daily chart, one thing stood out for me as a potential trade of the day: any breakout rally thru 1084, or any initiative rally that occurs above 1084 will likely bring in the daily time frame traders for a long targetting 1088 VPOC and possibly even 1090.75 gap fill.
It's structured the same way as today's breakout of 1066 implied a move targetting 1070 prior support and extended target 1074 VPOC.
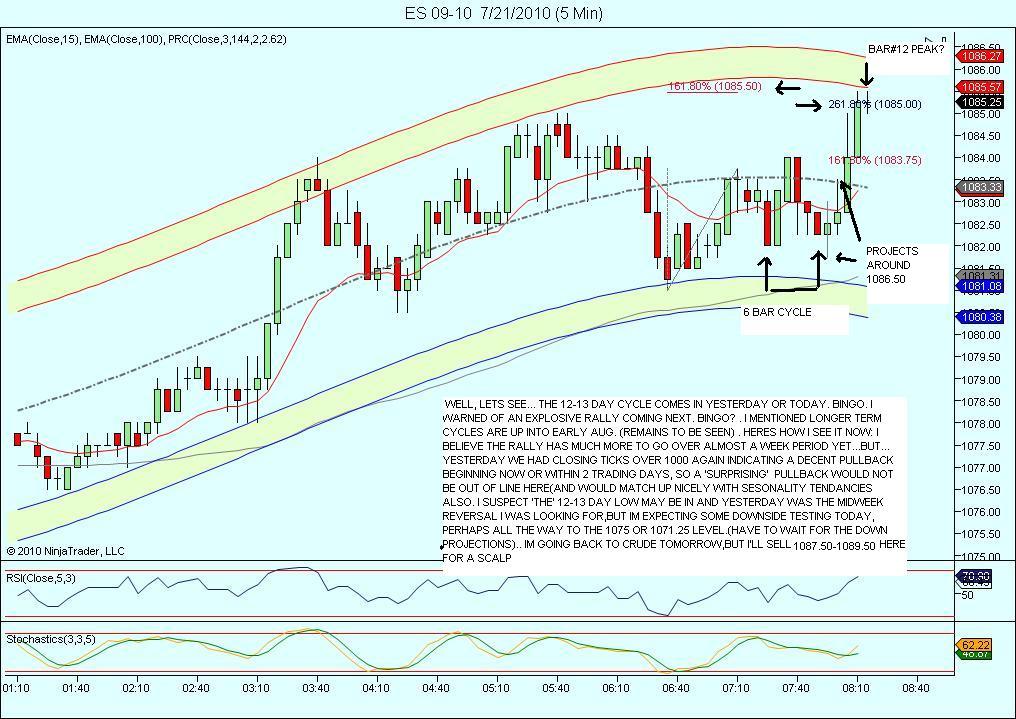
small short from 83.25...looking for 80.75 to fill in......ideal shorts will hopefully be in the day session with high $ticks above 86!!
such a small On session....who reports earnings tonight?? Good day for fades and gap fills
such a small On session....who reports earnings tonight?? Good day for fades and gap fills
Earnings after the bell:
SBUX, BIDU, WDC, QCOM
SBUX, BIDU, WDC, QCOM
Originally posted by BruceM
small short from 83.25...looking for 80.75 to fill in......ideal shorts will hopefully be in the day session with high $ticks above 86!!
such a small On session....who reports earnings tonight?? Good day for fades and gap fills
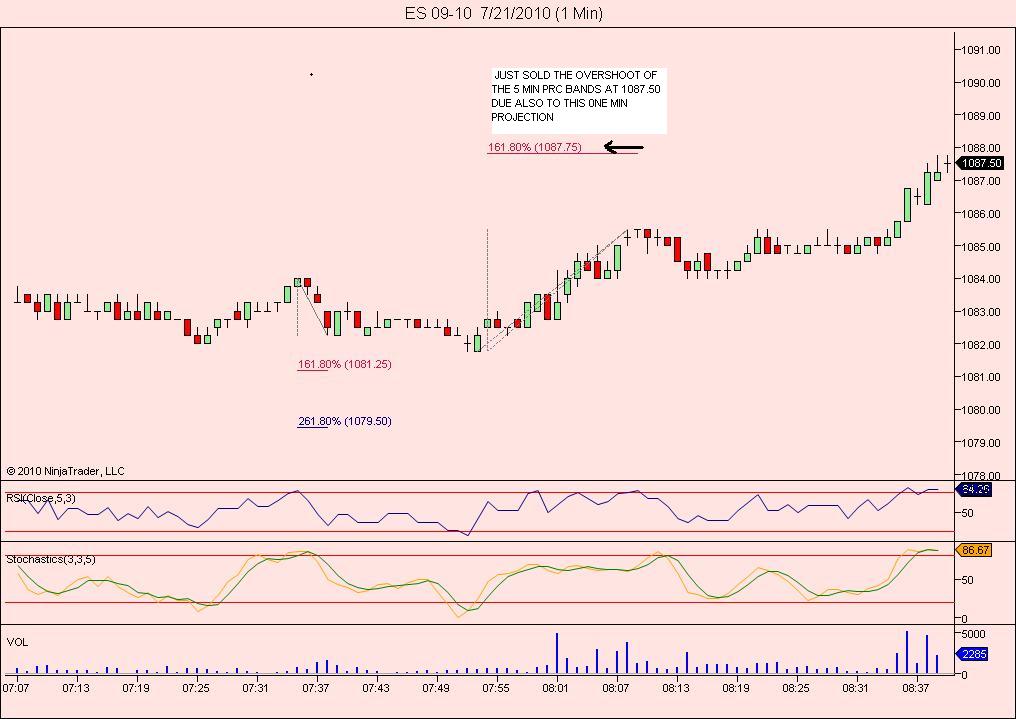
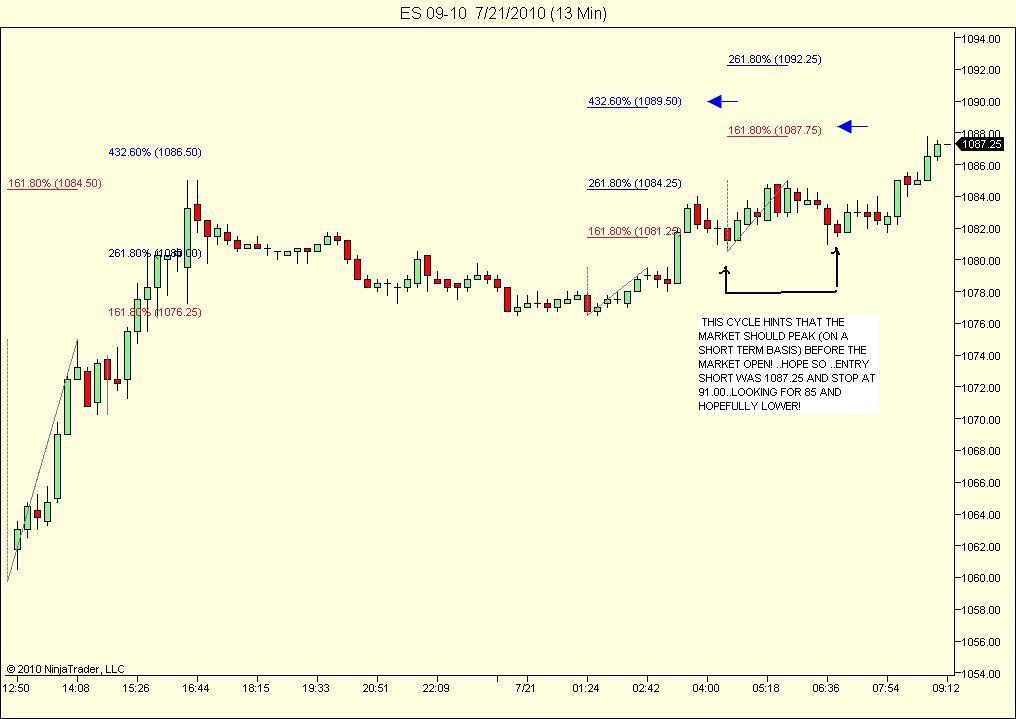
adding 2 contracts at 87.50...will post a chart later as to why my initial entry was a very poor place.......that was my error.....
It's ok to have trades that don't work because the market just doesn't do what we plan, but to initiate at a spot with poor trade location is a no - no....
targeting 85.25...
It's ok to have trades that don't work because the market just doesn't do what we plan, but to initiate at a spot with poor trade location is a no - no....
targeting 85.25...
Bruce,
I have noticed (more than once), that a big trend day UP that has a tight range AH often has a pop to the upside near/at RTH open and then comes back to earth. with this being MATD, downside and upside should be limited in the morning.
Worth Noting (I think) is the GAP that is still open above current prices.
Gap was created by down opening on 7-16-10 (gaps are a function of RTH, so the O/N moves into the gap are NOT going to show-up on someone's RTH only chart).
Gap in ES is open from 86.50 to 90.25 (if other people have mentioned this I am sorry, I have alot of junk that I am constantly researching and sometimes I do not get to reading analysis posted here until after the RTH is open)
first test of that gap (does not have to fill all the way to 90.25)
It might be worth alarming a few pennies shy of the SPY gap which is 109.21 - 109.68. if price gets there look for a-b-c sell pattern (or if there is air below...
Thanks everyone for the insights. Great stuff.
Here are S/R based on the previous days range.
S1 = 1043.25
S2 = 1035.75
R1 = 1088.25
R2 = 1095.75
Interesting we have traded close to R1 so far this morning.
Here are S/R based on the previous days range.
S1 = 1043.25
S2 = 1035.75
R1 = 1088.25
R2 = 1095.75
Interesting we have traded close to R1 so far this morning.
Sounds interesting to me Phileo - looking forward to it.
Emini Day Trading /
Daily Notes /
Forecast /
Economic Events /
Search /
Terms and Conditions /
Disclaimer /
Books /
Online Books /
Site Map /
Contact /
Privacy Policy /
Links /
About /
Day Trading Forum /
Investment Calculators /
Pivot Point Calculator /
Market Profile Generator /
Fibonacci Calculator /
Mailing List /
Advertise Here /
Articles /
Financial Terms /
Brokers /
Software /
Holidays /
Stock Split Calendar /
Mortgage Calculator /
Donate
Copyright © 2004-2023, MyPivots. All rights reserved.
Copyright © 2004-2023, MyPivots. All rights reserved.
