Es short term trading 7-19 -10
Numbers I'm watching on the upside
1069 Low Volume as per histogram
1073 - 1075 Pivot, High volume key number
1081 volume spike and 15 minute air pocket
downside numbers
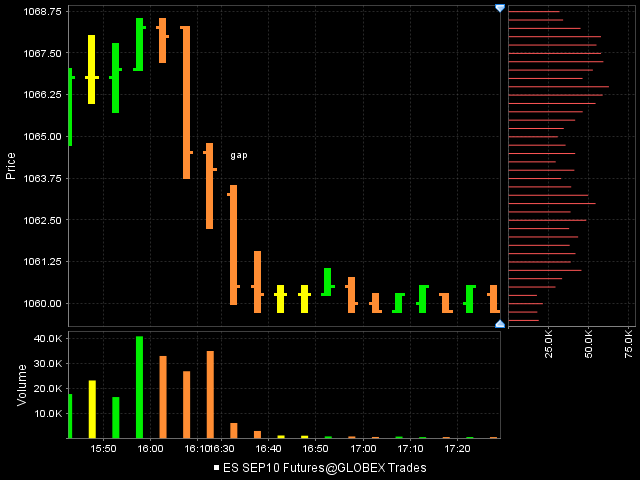
I'm hoping to sell rallies with high $ ticks in the am..that's the plan if we open above Fridays close...but trade down into key numbers BELOW 1061 will be buys for me on low $ tick readings
61 - 62 lots of volume
47 - 50 key number previous volume
39 - 41 key breakout point
Hoping to revise these after I fire up my IRT charts
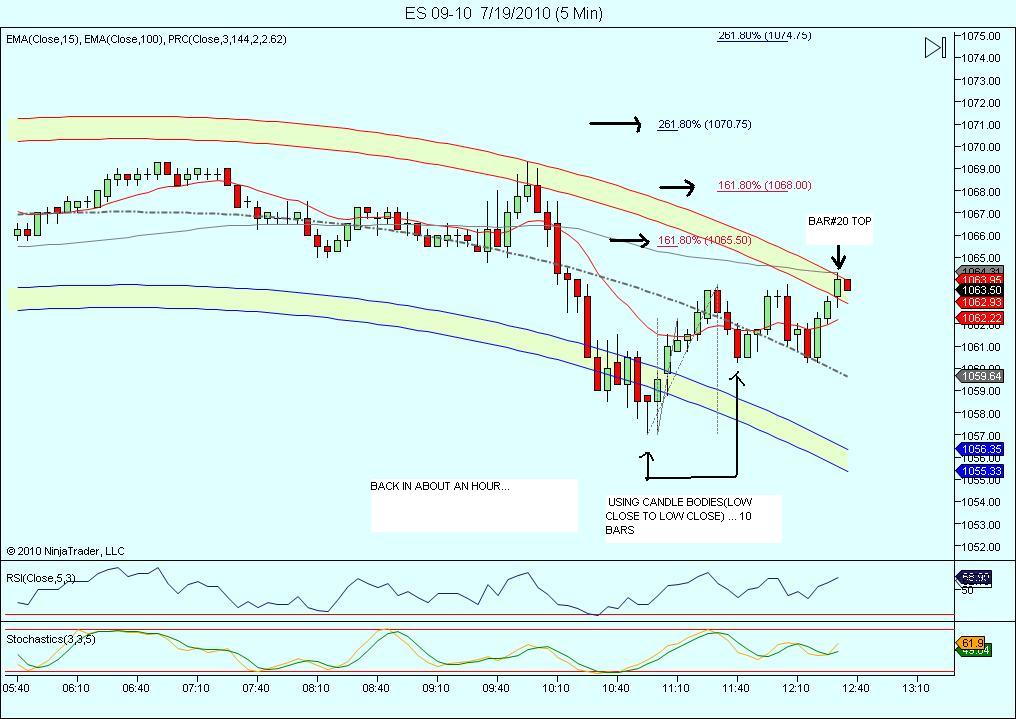
I have no choice but to start scaling out on most at 63. area because look what sits at those double lows at 60.25.....? another double low on 30 minute
have to leave for a bit so i covered one at 1063.00 plus 1.25 and up 2.25 on the day.. holding the other for a 1065.00 exit.. see ya soon ...(low at 12:51)
flat at 64.25...close enough and that double 30 minute low is now down there...taking some lunch and will hopefully have a shot at that low later on
small short 64.75...new swing highs take this out...otherwise they will try for that doublwe 30 minute low..down at 60.25...could take forevere
one off 62.50....holding one...stop at 64.75..certainly wouldn't be surprised to see another try to 65 before that low runs...
Phileo..notice where this up move stopped in the day session....at peak volume from the first 60 minutes of trade
I think as long as 65 can hold this back we will retest 61 and 59 today
so if I get stopped I will still look for shorts again!!
charts later
I think as long as 65 can hold this back we will retest 61 and 59 today
so if I get stopped I will still look for shorts again!!
charts later
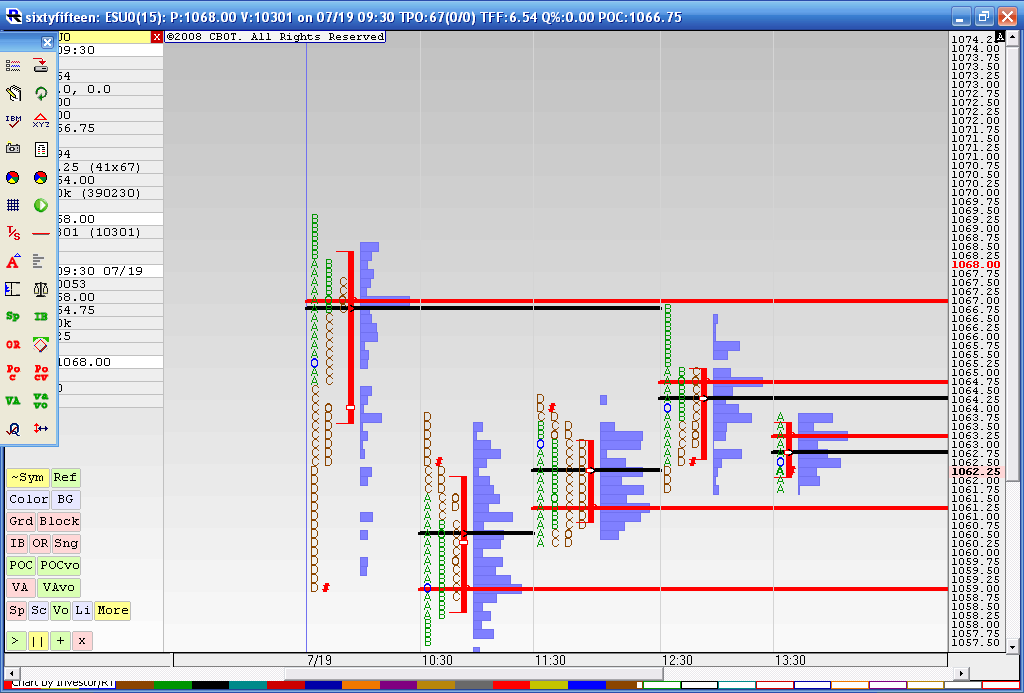
here is the 60 minute increments from todays day session...the heavy red lines are the high Volume POc's and the dashed black are time POC's
Note the perfect hit of 1066.75 which was the first hours key based on this idea..also note we haven't traded back to 64 , 61 and 59....YET!!
OK 61 just hit as I type..
Note the perfect hit of 1066.75 which was the first hours key based on this idea..also note we haven't traded back to 64 , 61 and 59....YET!!
OK 61 just hit as I type..
anyone getting any of this or is it only me and koolio now....and nice hold for that 65 target kool...!! Rockin!!
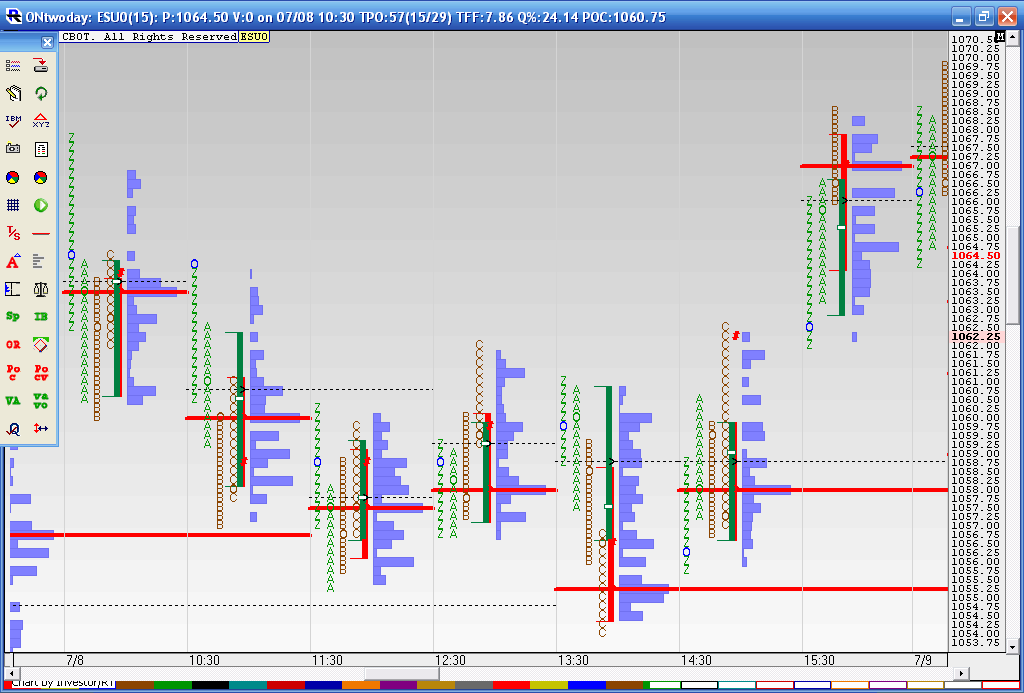
here is JUly 8th Phileo...note the 58 area and the 55...these are leftover 60 minute POC's that haven'ttraded...well 58 hit this morning and that is why it was important
Emini Day Trading /
Daily Notes /
Forecast /
Economic Events /
Search /
Terms and Conditions /
Disclaimer /
Books /
Online Books /
Site Map /
Contact /
Privacy Policy /
Links /
About /
Day Trading Forum /
Investment Calculators /
Pivot Point Calculator /
Market Profile Generator /
Fibonacci Calculator /
Mailing List /
Advertise Here /
Articles /
Financial Terms /
Brokers /
Software /
Holidays /
Stock Split Calendar /
Mortgage Calculator /
Donate
Copyright © 2004-2023, MyPivots. All rights reserved.
Copyright © 2004-2023, MyPivots. All rights reserved.


