Es short term trading 7-19 -10
Numbers I'm watching on the upside
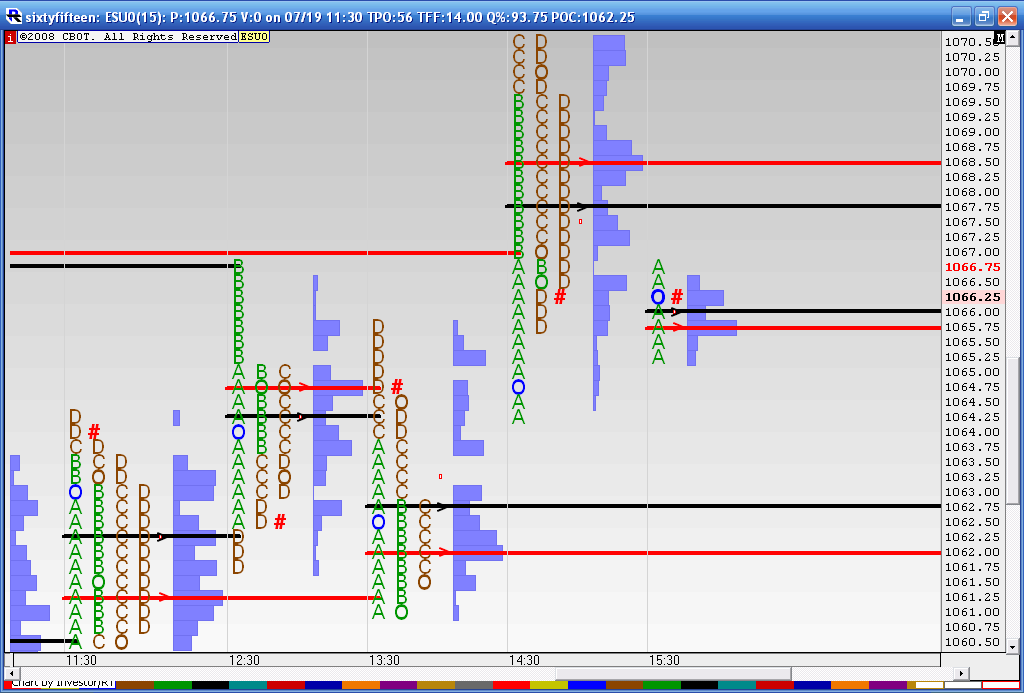
1069 Low Volume as per histogram
1073 - 1075 Pivot, High volume key number
1081 volume spike and 15 minute air pocket
downside numbers
I'm hoping to sell rallies with high $ ticks in the am..that's the plan if we open above Fridays close...but trade down into key numbers BELOW 1061 will be buys for me on low $ tick readings
61 - 62 lots of volume
47 - 50 key number previous volume
39 - 41 key breakout point
Hoping to revise these after I fire up my IRT charts
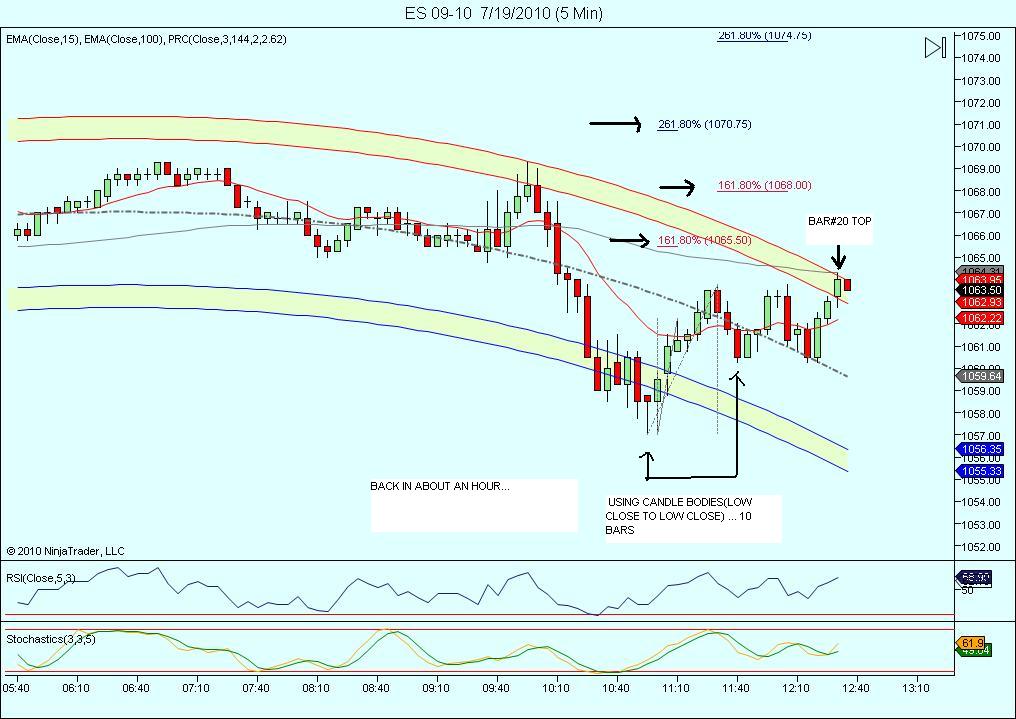
so if they pop it up then 68.75 need to hold it back..otherwis ethey will go for the 62 - 64 areas and lower
just letting these runners run..so here is how th e60 minute is looking on my volume chart gizmo!!
took one more at 64.75..holding one
64 is center of the range so that is best time to know where 50% mark is...
64 still looks weak to me from a profile view
flat 67.75....on last
why , why, why....what a finish....damn...fun to watch but sure would have liked to have bragging rights on that....ha!!
It ALWAYS amazes me that we can have great targets but just can't find away to hold for them....I gets it' all about watching gained equity slip away or losses!!
It ALWAYS amazes me that we can have great targets but just can't find away to hold for them....I gets it' all about watching gained equity slip away or losses!!
I did a refresh on the data and the 3:30 closing 60 minute bar had high volume up at 70.....data issues here...can anyone confirm who knows how to look at that...I've noticed the high volume on high and lows reverses the market quite often.....
seems like that low I wanted will get run in O/N at 4:30..we'll see if they clean up that 60!! without being on board
seems like that low I wanted will get run in O/N at 4:30..we'll see if they clean up that 60!! without being on board
Originally posted by BruceMwell, out at 1065.00 as planned, but a strange path to get there.. thought we'd see 1072 and came close!.. remember the last chart?...
anyone getting any of this or is it only me and koolio now....and nice hold for that 65 target kool...!! Rockin!!
pretty dam close on that 1070.75 and then quite a reversal ! Will we now decline into my wed timeframe?... stay tuned folks!...later!
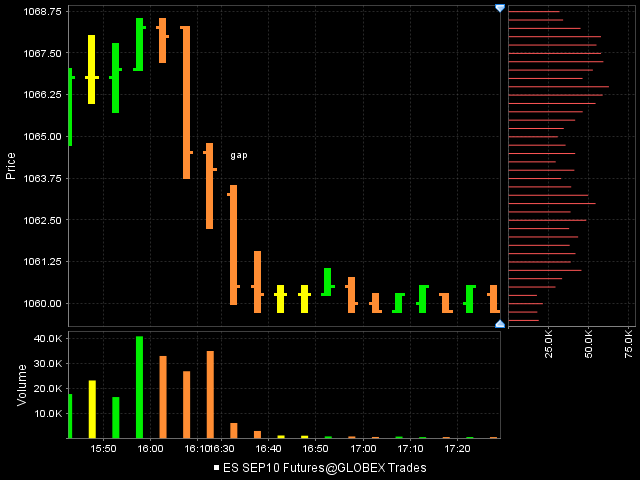
there is a gap between the on session and the day session close..these kind of consolidation days are good days to buy for that below this 61..target would be the gap near 64.....agressive perhaps for most
just an FYI and additional downside number is 55....butthis 60 looks solid so far
just an FYI and additional downside number is 55....butthis 60 looks solid so far
Emini Day Trading /
Daily Notes /
Forecast /
Economic Events /
Search /
Terms and Conditions /
Disclaimer /
Books /
Online Books /
Site Map /
Contact /
Privacy Policy /
Links /
About /
Day Trading Forum /
Investment Calculators /
Pivot Point Calculator /
Market Profile Generator /
Fibonacci Calculator /
Mailing List /
Advertise Here /
Articles /
Financial Terms /
Brokers /
Software /
Holidays /
Stock Split Calendar /
Mortgage Calculator /
Donate
Copyright © 2004-2023, MyPivots. All rights reserved.
Copyright © 2004-2023, MyPivots. All rights reserved.


