ES Day Trading 5-25-2011
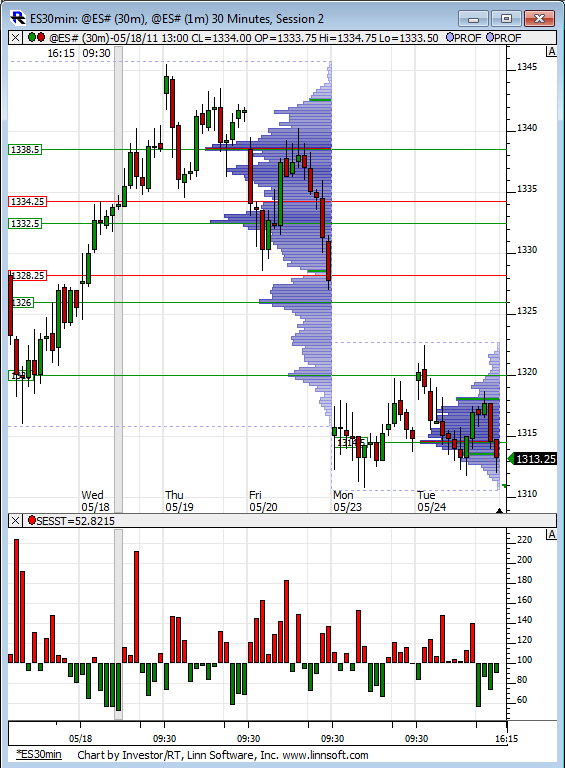
Two vprofiles on this chart. Last weeks and the developing one for this week. Tight range so far this week and the bell curve shaped profile signaling a fight between bulls and bears. Interesting to note VPOC is below last weeks range.
I'm mistaken about the trips... duh they were filled. I'm a noob. but I (think) I stand my that second air pocket.
I'm going back to mute... AGAIN.
I'm going back to mute... AGAIN.
Originally posted by TradeQueen
Dang it... I'm sorry.. I'm west coast and I keep forgetting. would of been just after 10:25am triples east coast. gosh I have a way of complicating everything!
[quote]Originally posted by BruceM
OH , ok..I don't look at either usually in the overnight but I will watch single prints on the 30 minute the from the Overnight session... I still don't see an air pocket from the O/N session though[quote]Originally posted by TradeQueen
at about 7:25am just after the triples... am I mistaken? Just one tick I beleive.
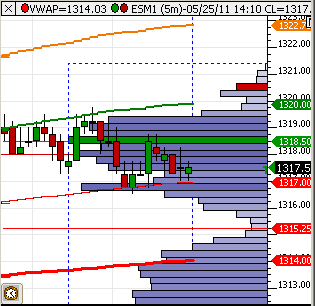
I went flat at 1316.50....that was an add on point to the 17's..and in hindsight a very poor area....now it is peak volume on the day..I hope the singles fill for those holding as a target
congrats on your great day today Koolio and nice to see ya back posting....I'm a day off on my accolades..!!
Thanks for sharing, Bruce.
Timing is what a new trader should focus on. A professional knows when to add to a position, when to take some off the table and when to close before being trapped. I make no bones or fuss about being able to do all of what a professional takes for granted, but with posts like the one you spent time on just recently, we should all be well on our way.
1% or $2% risk is well known to keep losses manageable. As are inverse martingale strategies 10X 8 ATR, 2X 14, &C.. Fractionating these numbers for lean data intraday is what's tough. Especially if you don't code or know the mechanics of accumulation/distribution. Market profile allows a player to find precise exits and entries but I'ld say if you can't find the same numbers by edges of moving averages the market profile can't be appreciated or utilized to its full potential.
The difference between position and scalping is none. The horizons are the exact same. It's in reading the fine-print so to speak en route from a to b that gives clues within the microcosm that traps traders who can't spot them.
By in large ranges are 1.5& per session. 4 on the week. Scale those number to a tenth on pull backs.
A running DDE of standard deviations of a typical 1 period moving average compared to price fluctuations is a good endeavor.
Again, Bruce, thanks.
Your welcome...always great to hear what others do to...there is no perfect method...just the one that works for us ..
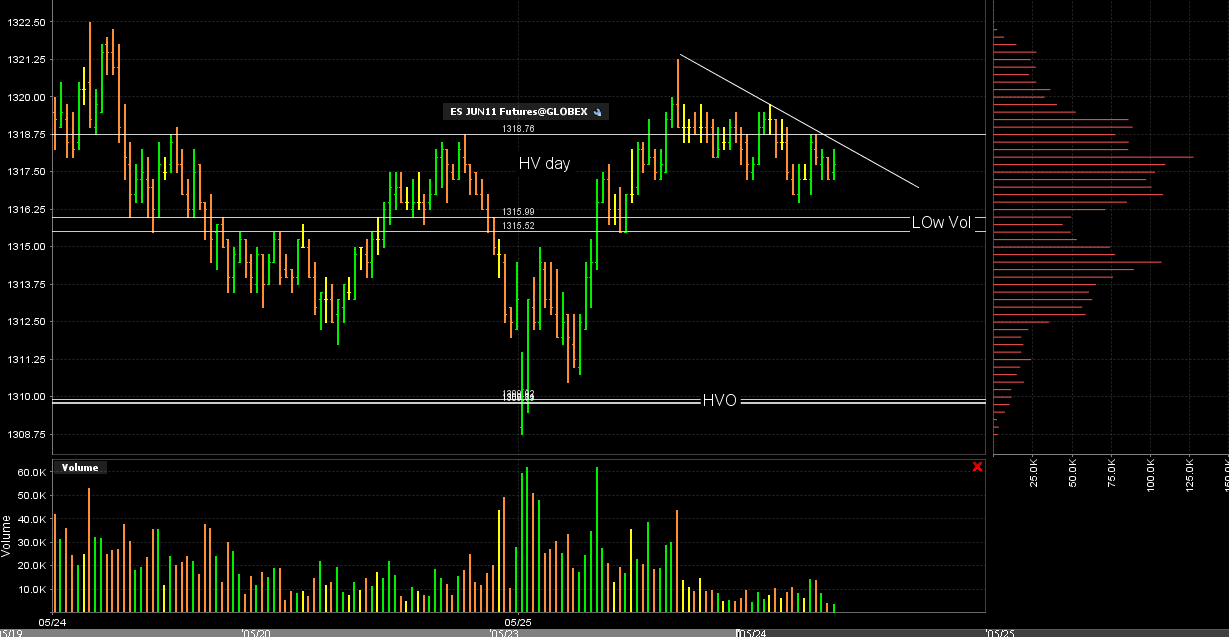
here is the update to that Volume pattern...not as perfect as it once was but you can still see the low volume area in between the high volume nodes..the 15.50 area...I added that sloping downtrendline for fun . I am not trading anymore today.
Volume has dropped off a lot now. we should in theory mean regress as long as volume doesn't come in above that 18.75 number to break away from the pattern...so far all buying above that 18.75 has been met by sellers....we'll see
Volume has dropped off a lot now. we should in theory mean regress as long as volume doesn't come in above that 18.75 number to break away from the pattern...so far all buying above that 18.75 has been met by sellers....we'll see
hi bruce, thanks for all your exaplantions, rationale and trading techniques. It adds immense value even if someone does not share your trading style.
I have a quick question, how far back do you look for areas to trade to/from ? for example, the 15-15.5 area was a big volume area yesterday but today it has been travelled through rather easily. In fact it is a low volume area today. So my question is, if the day ended right now, would the 15-15.5 area still be of importance to you for tomorrow's trading ?
Also, where did the 18.75 level you were looking at coming from ? you mentioned it early today as an area above which you would add to your shorts (and it turned out to be one of the peak volumes for the day) so i was wondering abt it
Final question, i know you consider o/n peak volume but once rth trading begins you look at total volume accumulating from taht point onwards or do you add to it what is carrying from the o/n session
thanks again for all the valuable input
Note to self...
Rule #1
If I suggest something and the person with the 10+ years "experience" doesn't see it... DON'T QUESTION IT!
In fairness to myself... If I seem argumentative... I'm not intending to be. People outside can hear me screaming... "What am I missing?"
The positive side... What I thought I knew... re: open air... I am now much more clear.
Thanks again for being patient with me Bruce as well as everyone else in the forum.
The 15.5 would be very important if not filled because it represents an area where buyers won for the day...so it would be important for tomorrow
look at your 30 minute charts or any time frame and look at yesterday afternoons swing high....it is a point where buying stopped and selling began yesterday afternoon...so a key price point at 18.75
I donot accumulate todays volume with the Overnight...some do..I don't until proven that it doesn't work.....I like to know of the key areas from overnight and reactions from the 8:30 reports but donot clump that in to my volume work from the day session data....I keep them seperate....some like to keep running total...I find just keeping the day session seperate is best for me....
I like to look above and below the current market...I will go back as far as needed meaning I have no time contraint on key areas...they stay valid....
I hope that helps and let me know if I missed anything
Originally posted by NickP
hi bruce, thanks for all your exaplantions, rationale and trading techniques. It adds immense value even if someone does not share your trading style.
I have a quick question, how far back do you look for areas to trade to/from ? for example, the 15-15.5 area was a big volume area yesterday but today it has been travelled through rather easily. In fact it is a low volume area today. So my question is, if the day ended right now, would the 15-15.5 area still be of importance to you for tomorrow's trading ?
Also, where did the 18.75 level you were looking at coming from ? you mentioned it early today as an area above which you would add to your shorts (and it turned out to be one of the peak volumes for the day) so i was wondering abt it
Final question, i know you consider o/n peak volume but once rth trading begins you look at total volume accumulating from taht point onwards or do you add to it what is carrying from the o/n session
thanks again for all the valuable input
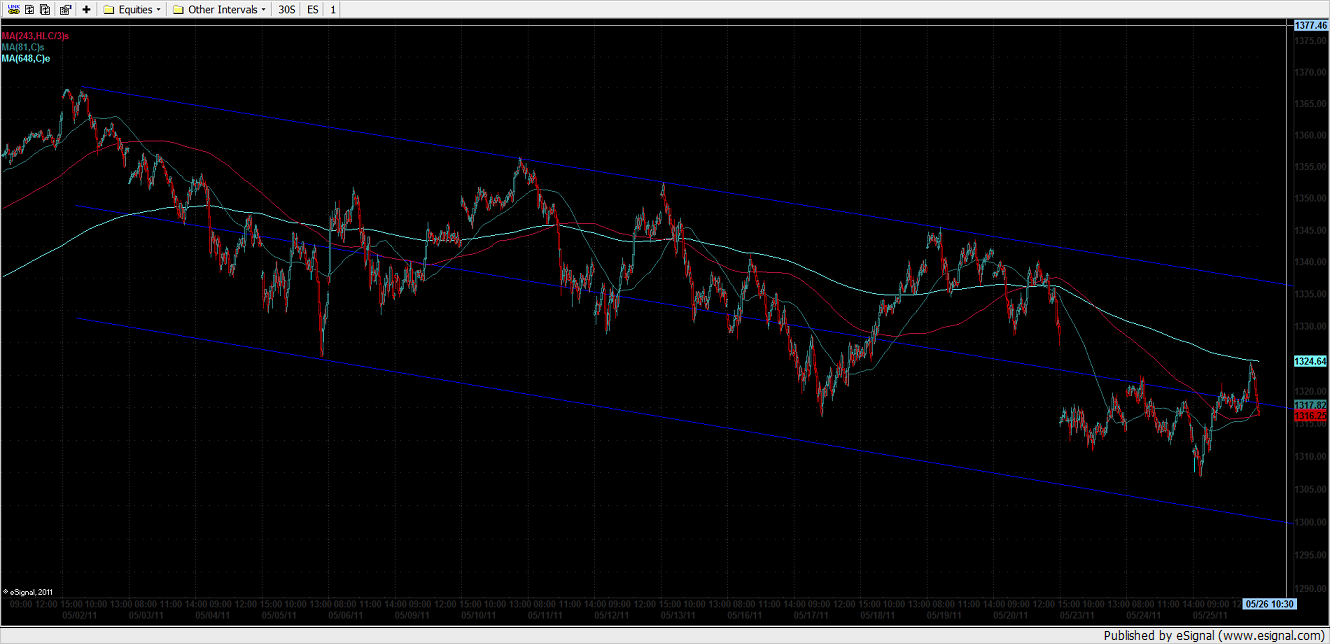
There's divergence in this market. This is a 5 min (daily numbers: 1 SMA, 3 typical SMA, & 8 EMA. The 8's leveling off and the 1 and 3 are trying to drive prices lower. Some heavy chop swings coming down the pike.
Chop I says. 12, 16, 21, 35, 43 I says.
Chop I says. 12, 16, 21, 35, 43 I says.
Emini Day Trading /
Daily Notes /
Forecast /
Economic Events /
Search /
Terms and Conditions /
Disclaimer /
Books /
Online Books /
Site Map /
Contact /
Privacy Policy /
Links /
About /
Day Trading Forum /
Investment Calculators /
Pivot Point Calculator /
Market Profile Generator /
Fibonacci Calculator /
Mailing List /
Advertise Here /
Articles /
Financial Terms /
Brokers /
Software /
Holidays /
Stock Split Calendar /
Mortgage Calculator /
Donate
Copyright © 2004-2023, MyPivots. All rights reserved.
Copyright © 2004-2023, MyPivots. All rights reserved.


