ES Day Trading 5-25-2011
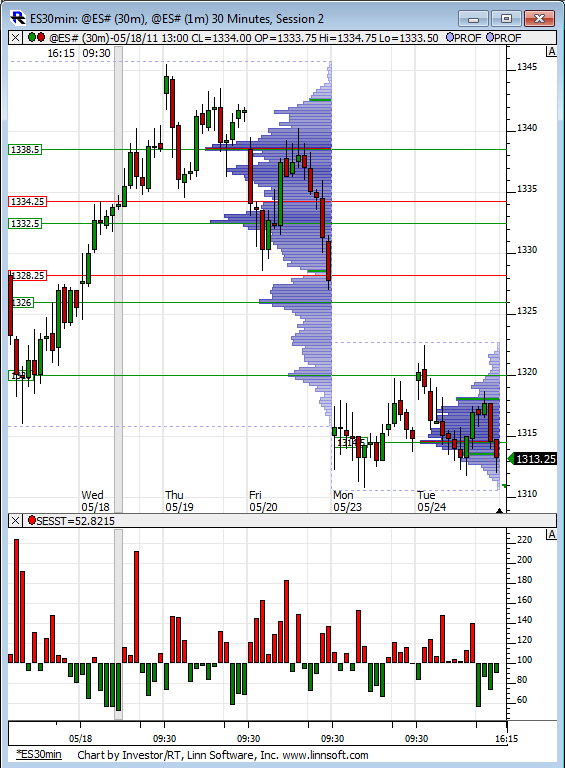
Two vprofiles on this chart. Last weeks and the developing one for this week. Tight range so far this week and the bell curve shaped profile signaling a fight between bulls and bears. Interesting to note VPOC is below last weeks range.
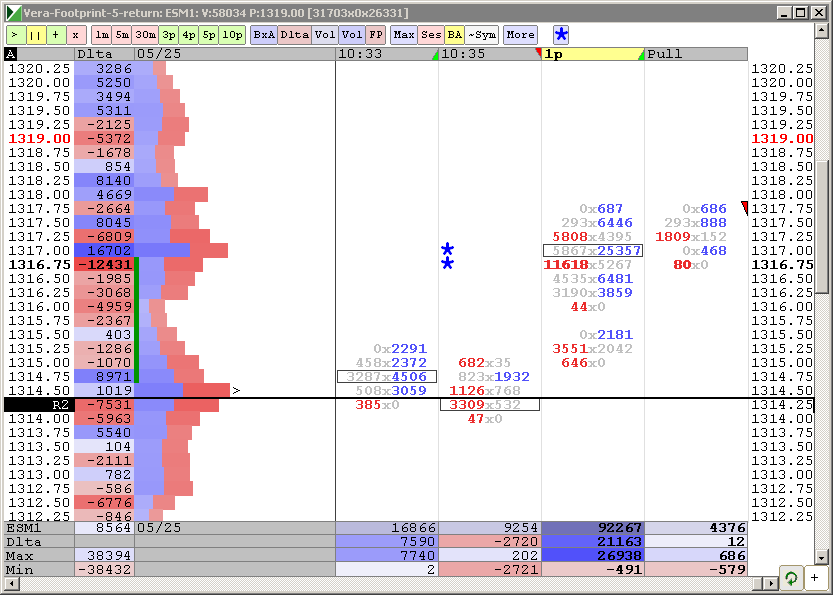
Nice chart, Lisa... the actual target here is 1314.50, but im still bailing early(if they let me!)
if this 30 minute bar closes without the retest we will have single prints that bigger traders will watch...I like to trade for those to fill in especially when inside the previous days range...
if single prints form outside of the range then those are harder to fill
if single prints form outside of the range then those are harder to fill
this will only be first set of singles.....if it was second set then it would be a GIVEN...almost, that I would be trading for them..
will add above the 90 minute highs if needed......
will add above the 90 minute highs if needed......
some days it just feels like they know where our targets are...this may be one of them..
added at 16.50.....still light
potential for single prints now that this bar has closed...ideal add would be above the 1318.75 if it prints
if you combine today and YD only for RTH trading you have what looks like the potential for a nice bell shaped distribution
Got it my 7 handles and going to lunch.
ideal for all of us shorts to keep this under the 90 minute highs...and let the breakout traders lose on that one
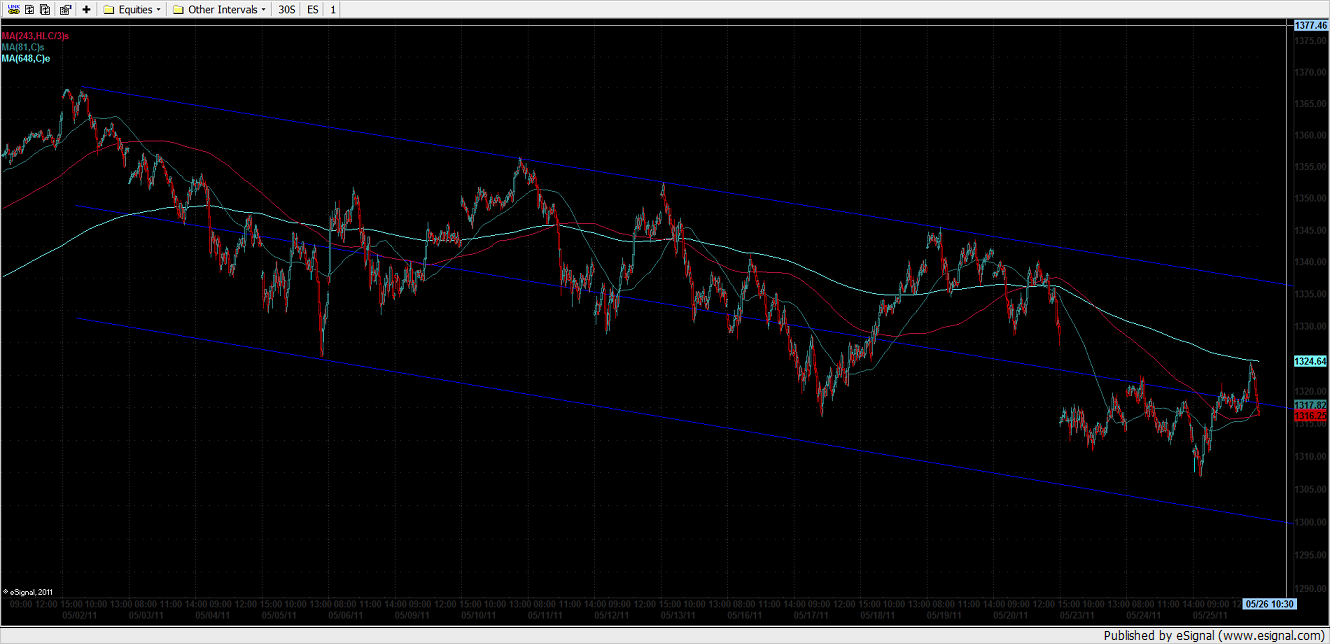
There's divergence in this market. This is a 5 min (daily numbers: 1 SMA, 3 typical SMA, & 8 EMA. The 8's leveling off and the 1 and 3 are trying to drive prices lower. Some heavy chop swings coming down the pike.
Chop I says. 12, 16, 21, 35, 43 I says.
Chop I says. 12, 16, 21, 35, 43 I says.
Emini Day Trading /
Daily Notes /
Forecast /
Economic Events /
Search /
Terms and Conditions /
Disclaimer /
Books /
Online Books /
Site Map /
Contact /
Privacy Policy /
Links /
About /
Day Trading Forum /
Investment Calculators /
Pivot Point Calculator /
Market Profile Generator /
Fibonacci Calculator /
Mailing List /
Advertise Here /
Articles /
Financial Terms /
Brokers /
Software /
Holidays /
Stock Split Calendar /
Mortgage Calculator /
Donate
Copyright © 2004-2023, MyPivots. All rights reserved.
Copyright © 2004-2023, MyPivots. All rights reserved.


