CME Euro FX Futures 6E
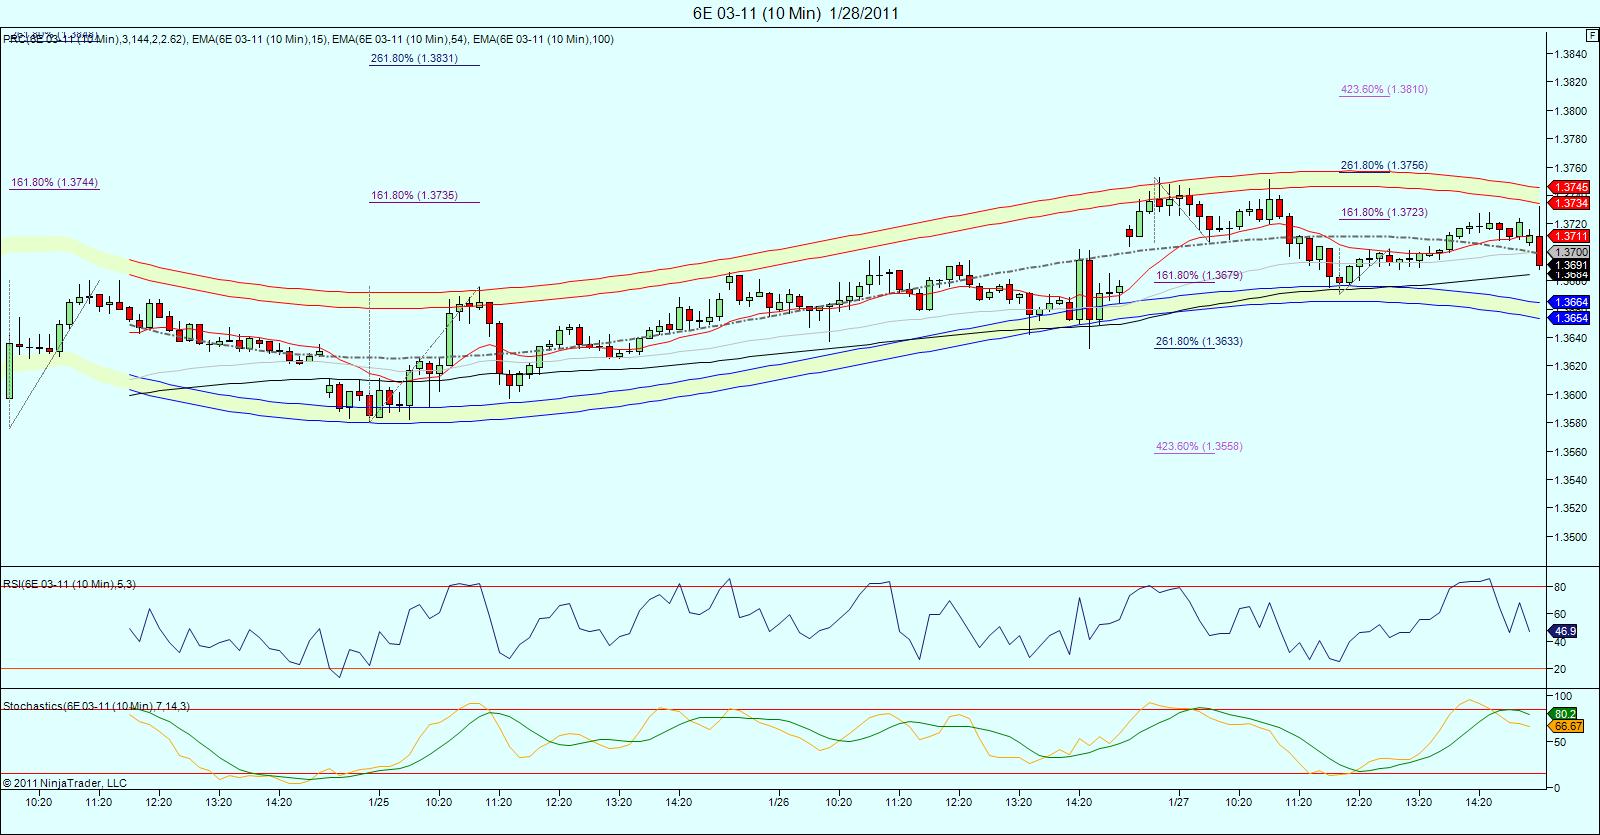
Red, sorry ,i was already asleep when you posted!.. I haven't had much time to look at it, but the daily chart indicates 1.3826 coming. Cycles are not very clear.... here's a real short term peak (10 min chart).. id be buying anywhere around the lower prc band...
- Page(s):
- 1
- 2
- 3
- 4
- 5
- 6
- 7
- 8
- 9
- 10
- 11
- 12
- 13
- 14
- 15
- 16
- 17
- 18
- 19
- 20
- 21
- 22
- 23
- 24
- 25
- 26
- 27
- 28
- 29
- 30
- 31
- 32
- 33
- 34
- 35
- 36
- 37
- 38
- 39
- 40
- 41
- 42
- 43
- 44
- 45
- 46
- 47
- 48
- 49
- 50
- 51
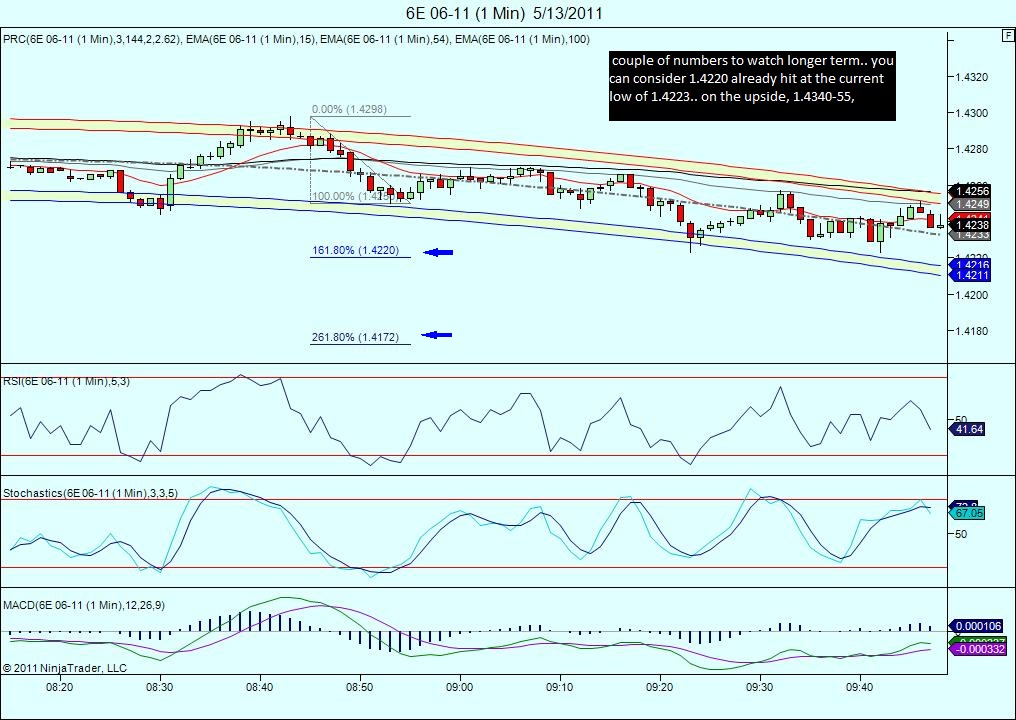
Thanks Koolblue I took out 20 pips from 1.4220
Koolblue,
After watching the charts in live action I am noticing the PRC2 bands are not stationary on Ninja. In other words they move up and down after the current candle closes. I have noticed movements as much as 10+ticks. Is this normal and what do you do to figure in a slippage factor? Thanks for your help.
john
See how its done?...went long 2 at 1.4272 ,covered at 1.4278...
Originally posted by John14THATS WHAT YOU WANT!!! You want them to be self adjusting constantly ..therin lies their power!...In time you will get used to them and you'll see the beauty of fading a move when it surges past them!
Koolblue,
After watching the charts in live action I am noticing the PRC2 bands are not stationary on Ninja. In other words they move up and down after the current candle closes. I have noticed movements as much as 10+ticks. Is this normal and what do you do to figure in a slippage factor? Thanks for your help.
john
in my opinion that's why you want to use them on 5min 30 min and 60+
Today for example around 6 am the 30 min showed a buy signal however, if you would have noticed the 5 minute chart, that was in play today. should you have taken the 30 min signal , you would have been severly punished. watching the right time frame is everything.. with that being said, if you would have used the 5 min charts that are inplay today.. you would have gained over 100 pts on the 6e
Today for example around 6 am the 30 min showed a buy signal however, if you would have noticed the 5 minute chart, that was in play today. should you have taken the 30 min signal , you would have been severly punished. watching the right time frame is everything.. with that being said, if you would have used the 5 min charts that are inplay today.. you would have gained over 100 pts on the 6e
next good short is at 1.4190-92 area ...5 min initial move from 1.4147 to 1.4164(the 2.618)..next buy scalp 1.4132-35...the 1.4174 high (which was the 1.618 of the above!) to 1.4159 ...
the 1.4190-92 has of course been negated...
next stop 1.4105?...1.4330 high to 1.4244 low...
At $85 billion/month, it cost Bernanke a little over $1 million for each job created last month. Well done, professor. -Tim Knight
Emini Day Trading /
Daily Notes /
Forecast /
Economic Events /
Search /
Terms and Conditions /
Disclaimer /
Books /
Online Books /
Site Map /
Contact /
Privacy Policy /
Links /
About /
Day Trading Forum /
Investment Calculators /
Pivot Point Calculator /
Market Profile Generator /
Fibonacci Calculator /
Mailing List /
Advertise Here /
Articles /
Financial Terms /
Brokers /
Software /
Holidays /
Stock Split Calendar /
Mortgage Calculator /
Donate
Copyright © 2004-2023, MyPivots. All rights reserved.
Copyright © 2004-2023, MyPivots. All rights reserved.

