CME Euro FX Futures 6E
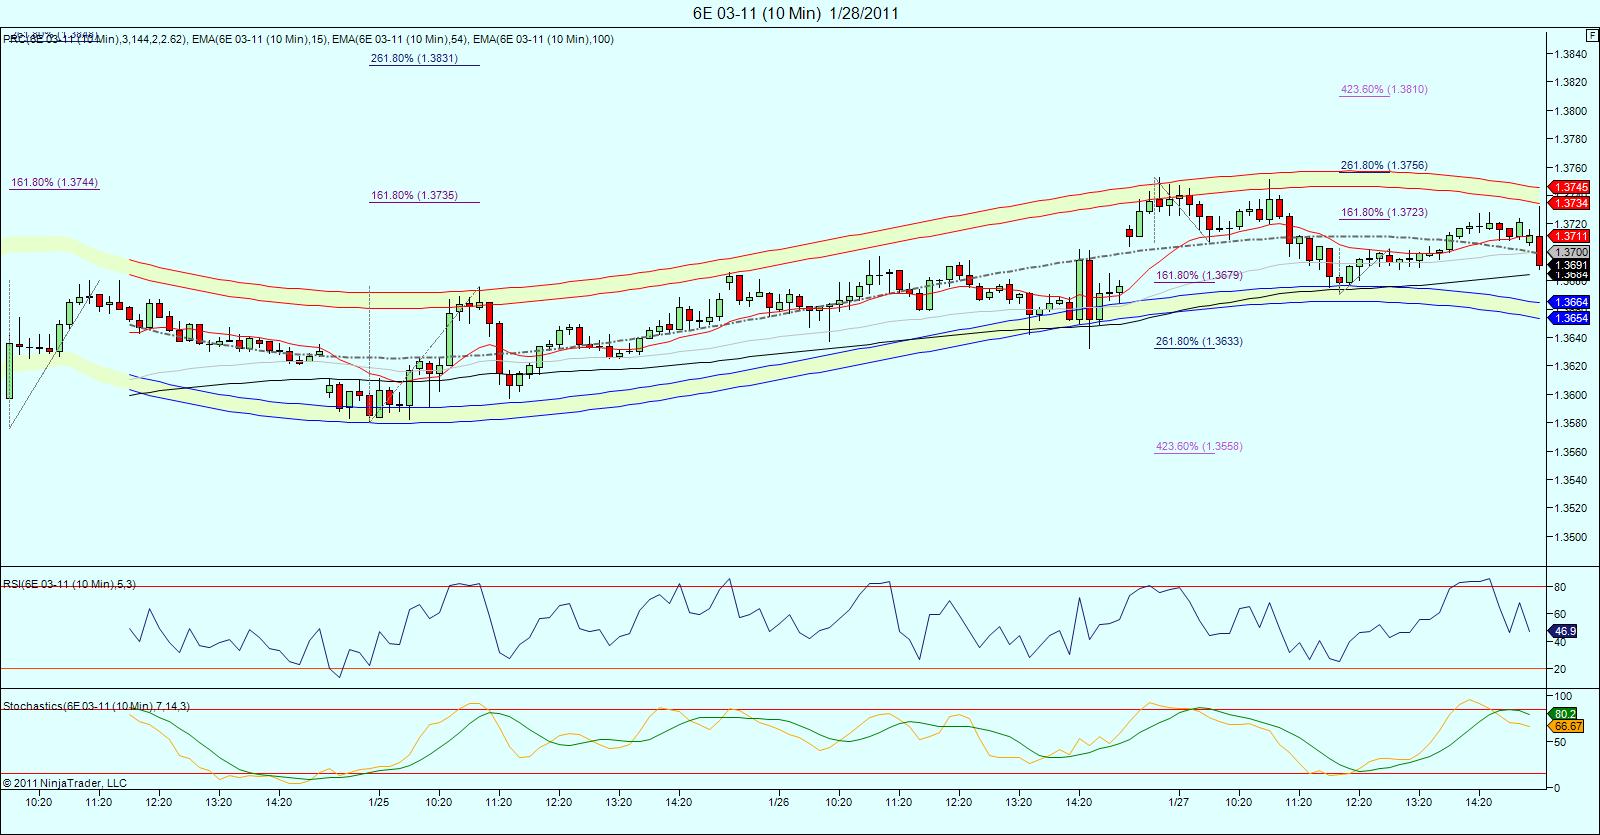
Red, sorry ,i was already asleep when you posted!.. I haven't had much time to look at it, but the daily chart indicates 1.3826 coming. Cycles are not very clear.... here's a real short term peak (10 min chart).. id be buying anywhere around the lower prc band...
- Page(s):
- 1
- 2
- 3
- 4
- 5
- 6
- 7
- 8
- 9
- 10
- 11
- 12
- 13
- 14
- 15
- 16
- 17
- 18
- 19
- 20
- 21
- 22
- 23
- 24
- 25
- 26
- 27
- 28
- 29
- 30
- 31
- 32
- 33
- 34
- 35
- 36
- 37
- 38
- 39
Originally posted by redsixspeed
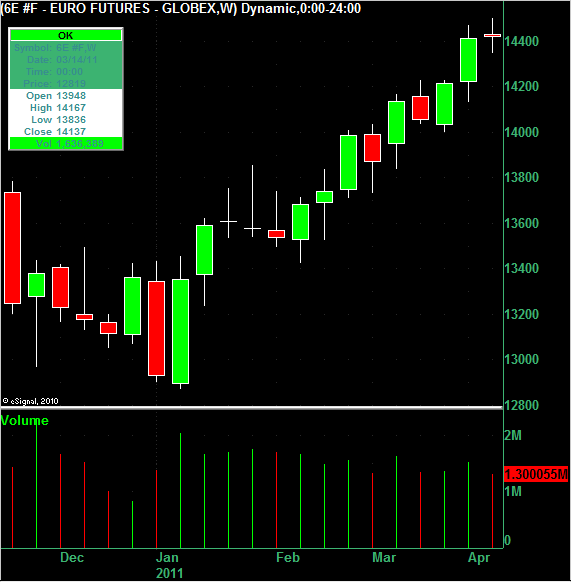
weekly "harami cross" forming ... it's close to the top and is not as bearish as if it were at the bottom of the pattern .. but this still a bearish pattern ...
I don't think that it's a harami cross because its high is higher than last week.
Thanks DT, my charts don't look the same as yours .. bad data I guess
but, I look more at the close. Even your close is at the top of the prior candle .. mine is down inside the prior candle .. you have a doji and I have a spinning top ..
but, I look more at the close. Even your close is at the top of the prior candle .. mine is down inside the prior candle .. you have a doji and I have a spinning top ..
Originally posted by redsixspeed
The daily chart I posted on page 38 of this thread, does not look the same as the chart in the daily notes secetion .. the chart in the daily notes is more bullish than my chart ...
======================================================================
I compared the daily notes chart with mine and found it different as well
Originally posted by redsixspeed
Originally posted by redsixspeed
The daily chart I posted on page 38 of this thread, does not look the same as the chart in the daily notes secetion .. the chart in the daily notes is more bullish than my chart ...
I compared the daily notes chart with mine and found it different as well
The chart that I posted above is a weekly chart and the one on the daily notes is a daily chart. When you said "...weekly "harami cross" forming..." you did mean a weekly chart right?
Yes DT, you are correct .. in my second post today I was just indicating the difference I see in the daily as well ..
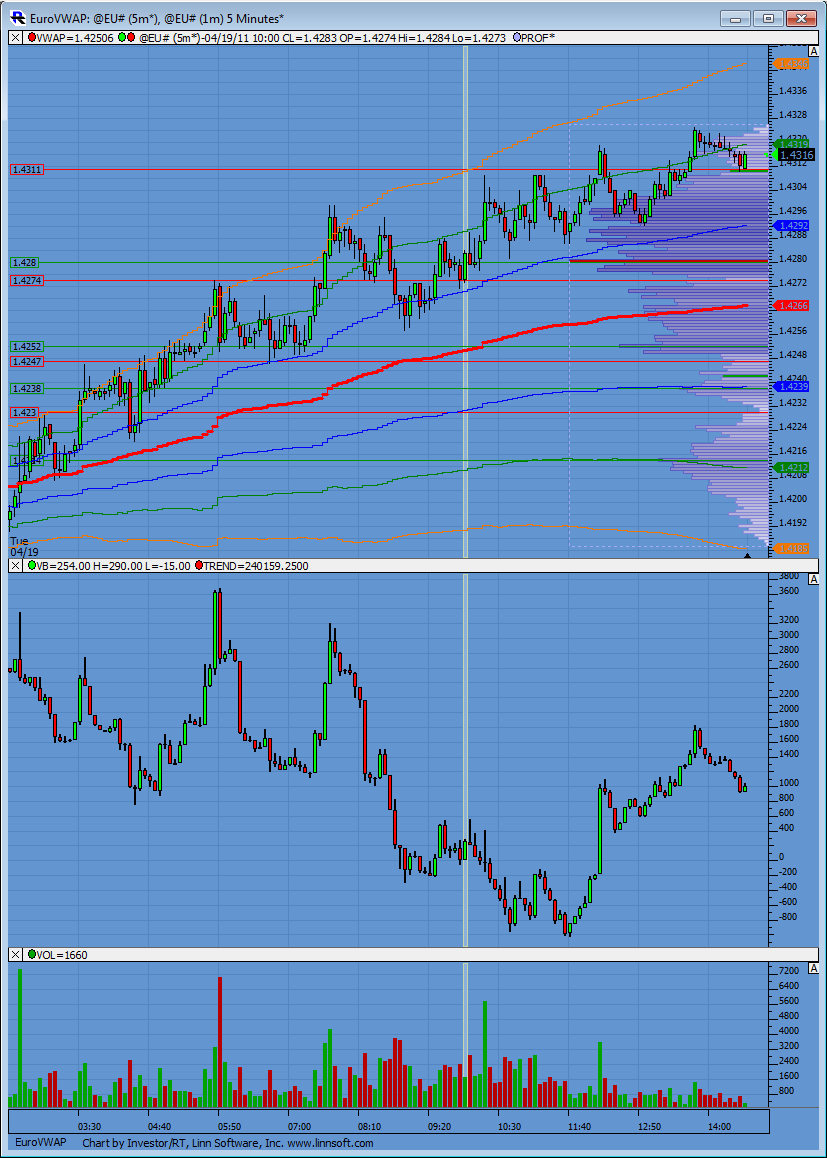
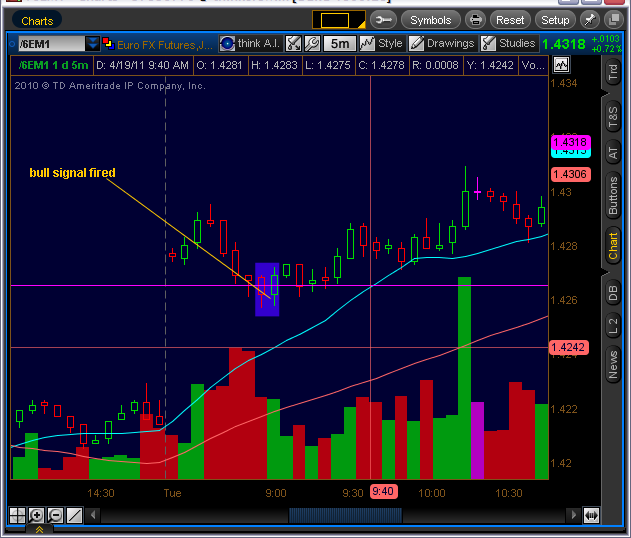
Out of action due to computer problems... sheese! Hope to beback soon!.. i see the 1.4186 low to the 1.4229 initial move provided a good short at the 2.618 of 1.4299. Iwould be long here looking for the daily proj. of 1.4269 or so!
hey kool, i've followed you for quite some time on the es chat/thread, so was surprised when you stopped showing up...are you planning on coming back to it anytime soon? otherwise i might make a permanent move to the 6e section...not trying to jump on your trades or anything like that (in fact i am still paper trading); just want to keep learning from you...thanks for all the help and posts !
Originally posted by koolblue
Out of action due to computer problems... sheese! Hope to beback soon!.. i see the 1.4186 low to the 1.4229 initial move provided a good short at the 2.618 of 1.4299. Iwould be long here looking for the daily proj. of 1.4269 or so!
====================================================================
computer problems .. .. get Toshiba ..
above 1.4265 I'am bullish
Originally posted by redsixspeed
above 1.4265 I'am bullish
Certainly above it now...
At $85 billion/month, it cost Bernanke a little over $1 million for each job created last month. Well done, professor. -Tim Knight
Emini Day Trading /
Daily Notes /
Forecast /
Economic Events /
Search /
Terms and Conditions /
Disclaimer /
Books /
Online Books /
Site Map /
Contact /
Privacy Policy /
Links /
About /
Day Trading Forum /
Investment Calculators /
Pivot Point Calculator /
Market Profile Generator /
Fibonacci Calculator /
Mailing List /
Advertise Here /
Articles /
Financial Terms /
Brokers /
Software /
Holidays /
Stock Split Calendar /
Mortgage Calculator /
Donate
Copyright © 2004-2023, MyPivots. All rights reserved.
Copyright © 2004-2023, MyPivots. All rights reserved.


