CME Euro FX Futures 6E
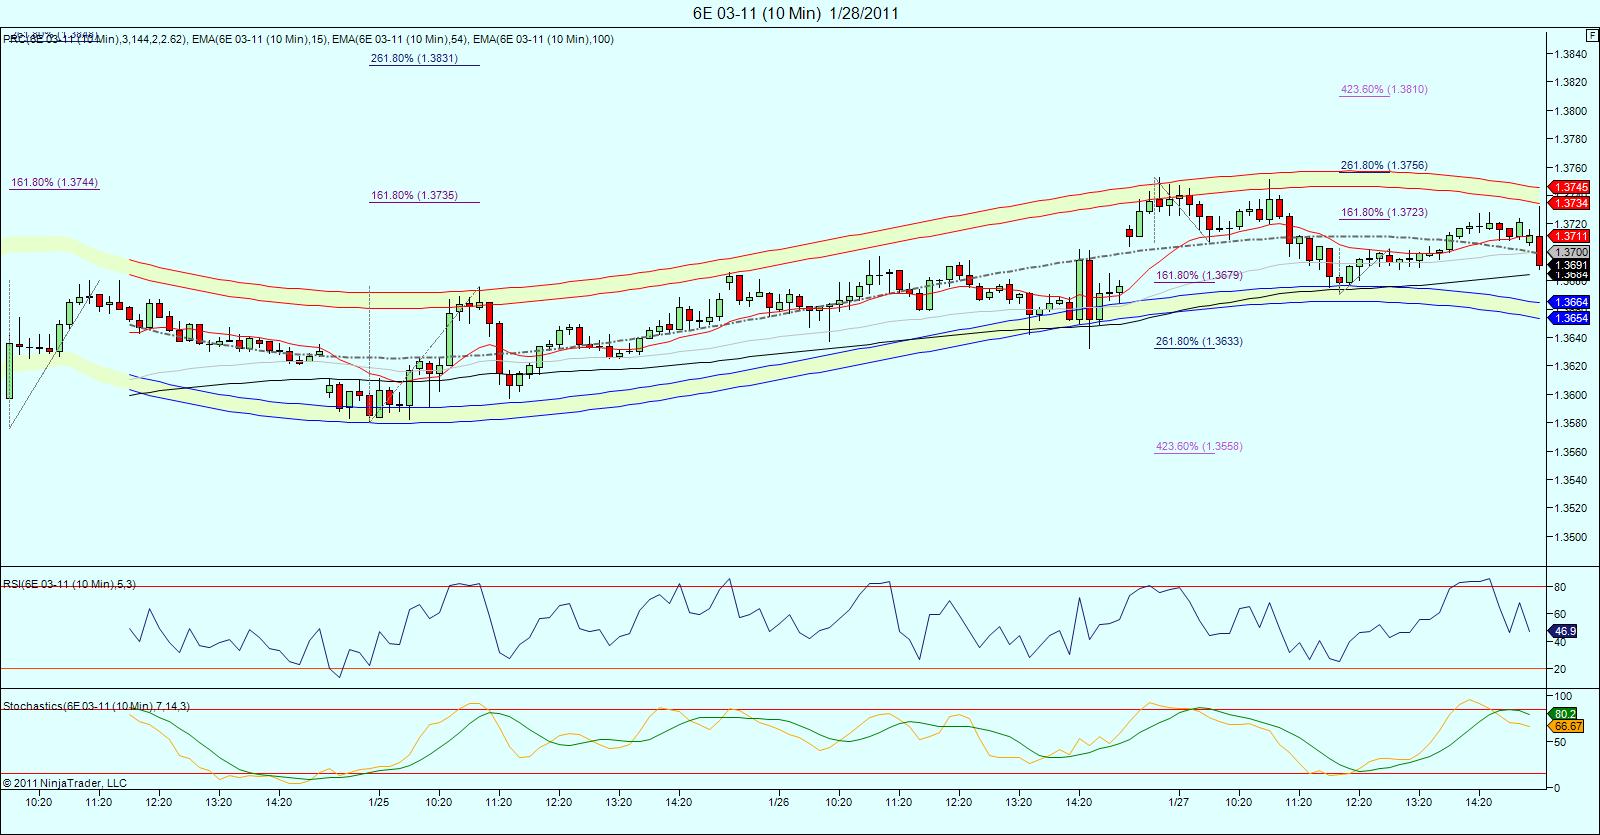
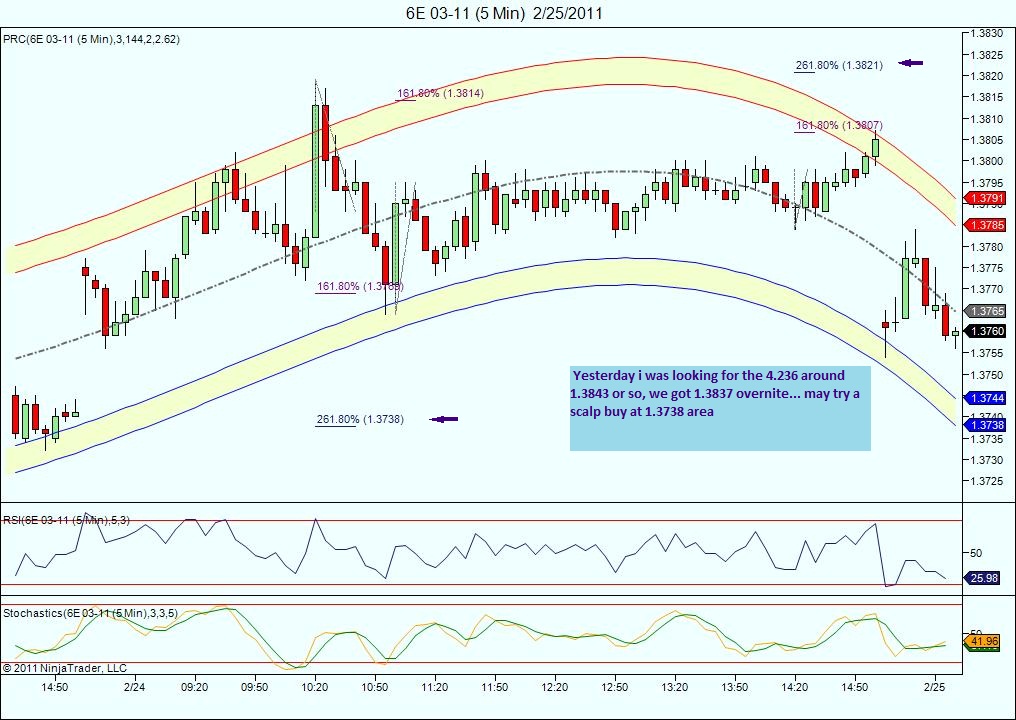
Red, sorry ,i was already asleep when you posted!.. I haven't had much time to look at it, but the daily chart indicates 1.3826 coming. Cycles are not very clear.... here's a real short term peak (10 min chart).. id be buying anywhere around the lower prc band...
Red / Joe or other... just curious how you break up the trading hours for 6e, between Globex session, Europe and US session. and Open / Close...
Curious, as I have spent most of my time following ES, so just interested in feedback on session times...
Thanks..
Curious, as I have spent most of my time following ES, so just interested in feedback on session times...
Thanks..
Originally posted by Lorn
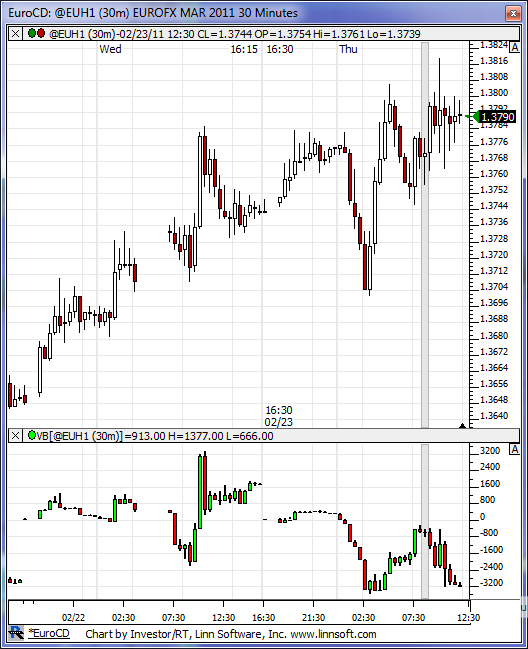
Red, here is a cumulative delta chart on the 6E set to 30 min time frame. Definitely showing selling pressure but prices not budging.
==================================================================
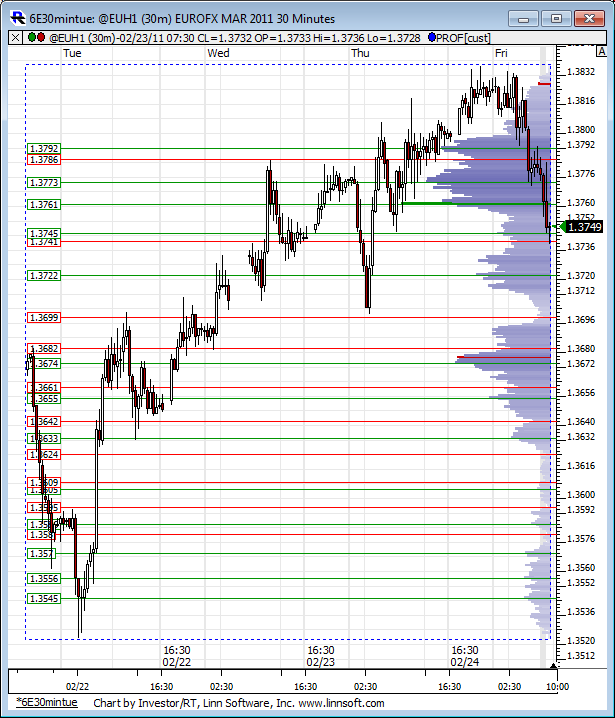
Thanks for the chart Lorn .. that 1.3781 is a tough nut
to crack .. 6e is in between a rock and a hard place
right now .. LOL ..
Originally posted by chrisp
Red / Joe or other... just curious how you break up the trading hours for 6e, between Globex session, Europe and US session. and Open / Close...
Curious, as I have spent most of my time following ES, so just interested in feedback on session times...
Thanks..
======================================================================
This should help:
http://www.cmegroup.com/trading/fx/g10/euro-fx_contract_specifications.html
Here's the sessions for FX...
Sydney 5:00pm-2:00am
Tokyo 7:00pm-4:00am
London 3:00am-11:00am
New York 8:00-5:00
Sydney 5:00pm-2:00am
Tokyo 7:00pm-4:00am
London 3:00am-11:00am
New York 8:00-5:00
Red
Don't know where the 6e bounced, but the spot bounced 3775 thats exact PP. A bit of hind sight never hurt fwiw
Don't know where the 6e bounced, but the spot bounced 3775 thats exact PP. A bit of hind sight never hurt fwiw
3730 is S1 should provide a couple low risk scalps
We are below yesterdays 50% mark, so 3765 should be a good short scalp.
A little resistance at the 1min mid line bollinger bands knocking it back down.
- Page(s):
- 22
- 23
- 24
- 25
- 26
- 27
- 28
- 29
- 30
- 31
- 32
- 33
- 34
- 35
- 36
- 37
- 38
- 39
- 40
- 41
- 42
- 43
- 44
- 45
- 46
- 47
- 48
- 49
- 50
- 51
- 52
- 53
- 54
- 55
- 56
- 57
- 58
- 59
- 60
- 61
- 62
- 63
- 64
- 65
- 66
- 67
- 68
- 69
At $85 billion/month, it cost Bernanke a little over $1 million for each job created last month. Well done, professor. -Tim Knight
Emini Day Trading /
Daily Notes /
Forecast /
Economic Events /
Search /
Terms and Conditions /
Disclaimer /
Books /
Online Books /
Site Map /
Contact /
Privacy Policy /
Links /
About /
Day Trading Forum /
Investment Calculators /
Pivot Point Calculator /
Market Profile Generator /
Fibonacci Calculator /
Mailing List /
Advertise Here /
Articles /
Financial Terms /
Brokers /
Software /
Holidays /
Stock Split Calendar /
Mortgage Calculator /
Donate
Copyright © 2004-2023, MyPivots. All rights reserved.
Copyright © 2004-2023, MyPivots. All rights reserved.


