ES short term trading 7-7-10 5921
Just a giant range between 1039 and 1006
key zones
1037 - 1039
1025 - 1028
1014.50
1006
key zones
1037 - 1039
1025 - 1028
1014.50
1006
Originally posted by BruceM
I missed it but anyone who traded for that triple run caught a fairly good move
Bruce, any thoughts as to what might happen this afternoon?
I'm trying to sell if they break new highs before the 41.75 retest...double top up there stopped my sale...sometimes they hold and certainly aren't perfect
If you take the 5 day average RTH range (22.65)
and add it to today's RTH Low 1024.74
the sum is 1047.40
and add it to today's RTH Low 1024.74
the sum is 1047.40
rat 43.75!! with a key zone..gotta go easy and watch the volume at new highs now....if they can push it....air having a tough time filling on this trending day..they gonna run out that high!!
s 46.50 and hating it !!
if this trend is really strong they won't come back for that 41.50 area..tough trade!!
they like to test a previous 30 minute low in trends and haven't had a test in (5) 30 minute bars...just not sure it's gonna happen now either
flat 46//not a good time for me
flat 46//not a good time for me
Phileo,,,I see no reason we can't test 50 today at some point and obviously that 39 - 41 area needs to hold back any decline...other than that I have no real clue..after the first 90 minutes my trade profits decline but I'm slowly getting better...not fading as much in the afternoon period ( 2 pm on ) helps or at least going lighter and selective
1047 should be major resistance from 6/29, but I'm too scared to step in front of this runaway train.
nice Paul..here we are !!
Originally posted by PAUL9
If you take the 5 day average RTH range (22.65)
and add it to today's RTH Low 1024.74
the sum is 1047.40
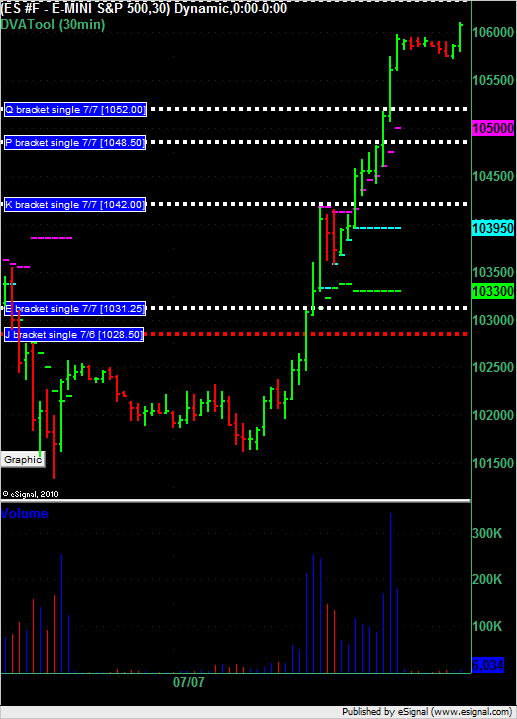
Here's a 30 minute chart of the ES with the DVATool on it showing 1 filled in single print from Tuesday (red horizontal dotted line) and 4 single prints left from today's trading (white horizontal dotted lines).
Emini Day Trading /
Daily Notes /
Forecast /
Economic Events /
Search /
Terms and Conditions /
Disclaimer /
Books /
Online Books /
Site Map /
Contact /
Privacy Policy /
Links /
About /
Day Trading Forum /
Investment Calculators /
Pivot Point Calculator /
Market Profile Generator /
Fibonacci Calculator /
Mailing List /
Advertise Here /
Articles /
Financial Terms /
Brokers /
Software /
Holidays /
Stock Split Calendar /
Mortgage Calculator /
Donate
Copyright © 2004-2023, MyPivots. All rights reserved.
Copyright © 2004-2023, MyPivots. All rights reserved.
