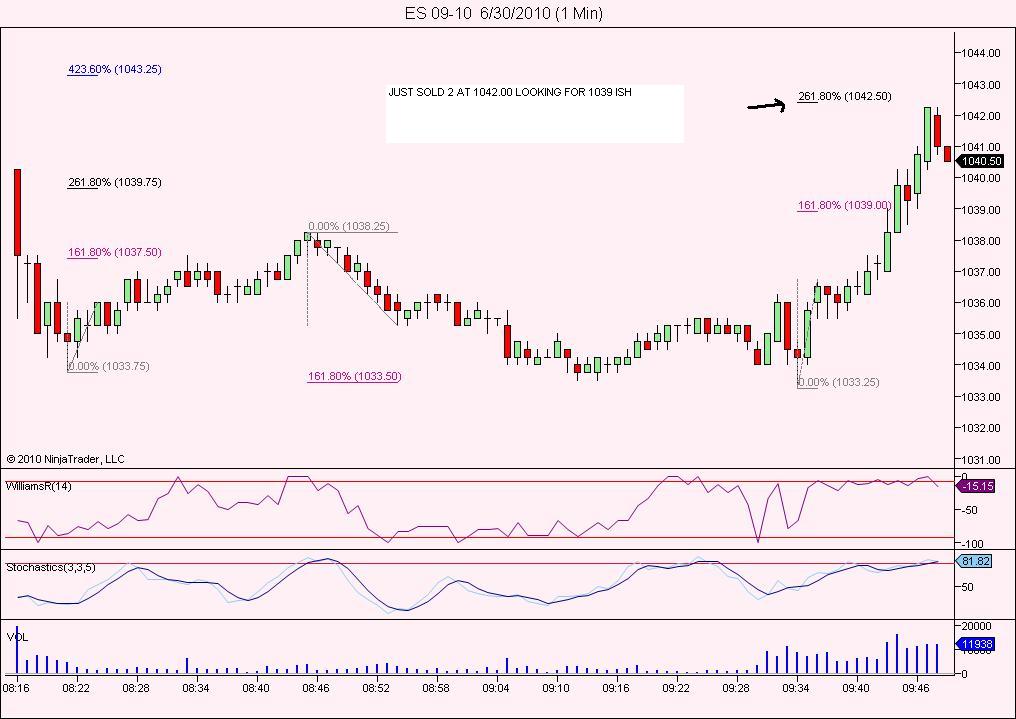
ES short term trading 6-30-10
In my opinion the market tipped its hand yesterday signalling lower ,possibly much lower, prices coming in the next few weeks/months.Try as i might i cant find any longer term projection, or for that matter, fib relationship of any kind that says 1030 could be the bottom of the decline which started in April!. Therefore, from a kools tools perpective, There are lower prices coming soon! so like everyone else, i expect an oversold market to muster a dead cat bounce of some sort ,but likely from slightly lower prices first. The closest numbers i can find are the original high of 1129.50 to its initial move low was 1103.25. this has a 4.236 termination ratio of around 1018.50 and if A was from 1211.25 to 1032.75 ans B was complete at 1129.50 then C=.618A AT 1019.25. Look folks, i know im really reaching here but,1030 is NOT 'THE BOTTOM'And i dont think 1018-19 is either (we'll see the 900 's at some point.) but this zone might be good for a dead cat bounce. right now i have short term projections around 1023.50-1024.75 which could do the same. Its also possible of course that the bounce has already started , we'll just have to see what develops today . Anything is possible today, but by all rights seasonally thurs and friday should have some upside pressure. The main point of this discourse is that much lower prices are ahead in the next month or so (950-960?) in my opinion. As always time will tell!... good luck gang!
i will likely be a buyer at any move to 1030 -1030.50 this morning .. that is the 4.236 from the overnight 1044.50-1041.25 move and would hit the lower prc band on the 30 min..... there is obviously a danger of a move lower to 1023-24 but i like the odds and the oversold technicals seem in agreement.
i think today will be difficult to trade unless we get a good move lower this morning to say 1018-1023 or so. You might want to re-read the first post of this thread. That might set up the positve divergencies that we just dont really see yet.
for me this is a buy the break, sell the rallies type of day...hopefully with high tick readings......prefer the buys too kool under 1034...my thinking is that all the volume happened above 1034.....so it will take a lot of volume to keep it under there today....
nice test of POC of 1042.50....better odds for 1036 trading in RTH....so we can look to buy or sell above that in RTH if it hasn't printed.at the open....
1027 is another point I'm watching but only if we drop down ther efirst
nice test of POC of 1042.50....better odds for 1036 trading in RTH....so we can look to buy or sell above that in RTH if it hasn't printed.at the open....
1027 is another point I'm watching but only if we drop down ther efirst
long 2 at 34.50..target 36.50 and37.50 at open ..I hope
Originally posted by BruceM
long 2 at 34.50..target 36.50 and37.50 at open ..I hope
heads up, there's an econ.rpt due out in 5min.
starting short at 40 even...light as we may be early
$ticks at 900...added 3 at 41.75...thanks phileo
air down into 36.50 area
Originally posted by phileo
Originally posted by BruceM
long 2 at 34.50..target 36.50 and37.50 at open ..I hope
heads up, there's an econ.rpt due out in 5min.
hmmm.... the report was supposed to come out 645a(PST), but the market ran-up starting 642a, as if it already knew (or didn't care) about the result.
"went short at 38 even. I had a bearish bias this afternoon and after the fake breakout to the upside it confimed me going short"
Emini Day Trading /
Daily Notes /
Forecast /
Economic Events /
Search /
Terms and Conditions /
Disclaimer /
Books /
Online Books /
Site Map /
Contact /
Privacy Policy /
Links /
About /
Day Trading Forum /
Investment Calculators /
Pivot Point Calculator /
Market Profile Generator /
Fibonacci Calculator /
Mailing List /
Advertise Here /
Articles /
Financial Terms /
Brokers /
Software /
Holidays /
Stock Split Calendar /
Mortgage Calculator /
Donate
Copyright © 2004-2023, MyPivots. All rights reserved.
Copyright © 2004-2023, MyPivots. All rights reserved.
