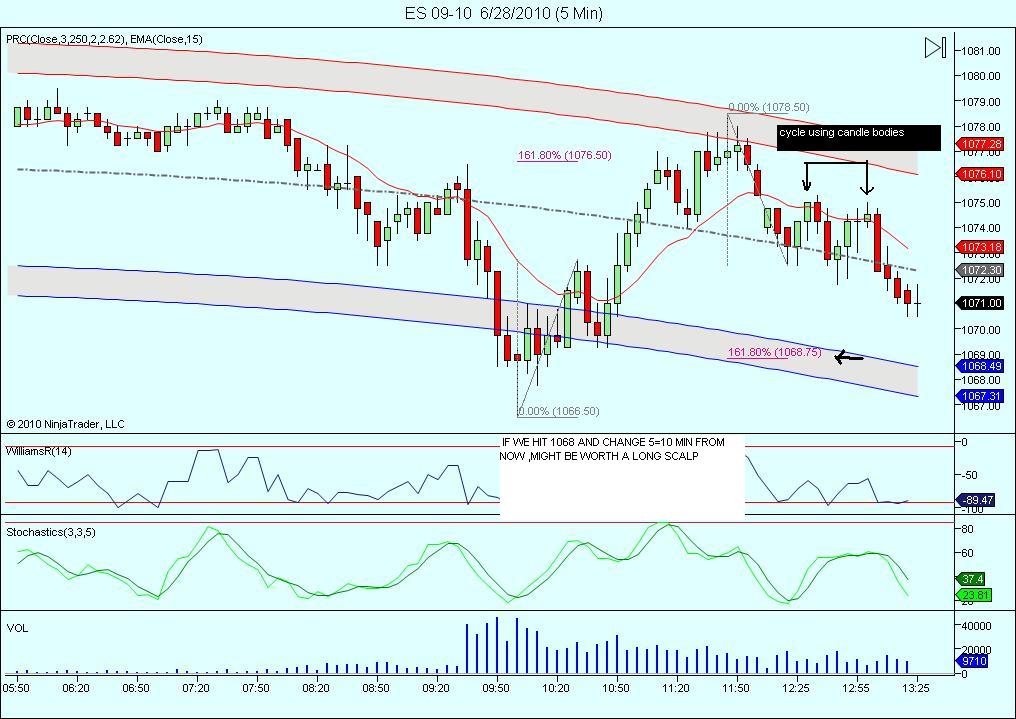
ES short term trading 6-28-10
I just created a Market Profile using the RTH sessions for ES from last week, Monday through Friday. So the 1 week Value Areas are:
VAH=1102.00
POC=1075.50
VAL=1063.50
This week's Economic Events.
VAH=1102.00
POC=1075.50
VAL=1063.50
This week's Economic Events.
Triples at 1078.75 also.
SINCE A DIRECT HIT O/N A 2.618 PROJECTION LEADS TO THE TENDANCY TO REBOUND TO THE 1.618 (1074.75) i'll cover thereon this scalp... i still tend to think this could resolve itself on the upside tho... sesonals are very positive next 2-3 days
there it is ..out 1074.75... i'll show a chart later ,but i think we'll see either 1083.50 or 1085 and change later today...(after the requisite battle at fridays 1079.50-75 highs)
IF I WAS THE MARKET AND WANTED TO GO HIGHER, BUT SCREW THE MOST AMOUNT OF PEOPLE, ID 'MISH-MASH' around most of the day basically sideways, then surgeat the end of the day.... but thats just me.lol
those triples from friday got cleaned up in the O/N session.....I don't look at O/N triples but I do consider triples run even if they are run in O/N.....a double standard in some ways.......anyone take the short off the lowest range 15 minute bar of the day into the 78 - 81 zone......it's all there..!!
Originally posted by Piker
Triples at 1078.75 also.
Originally posted by BruceM
those triples from friday got cleaned up in the O/N session.....I don't look at O/N triples but I do consider triples run even if they are run in O/N.....a double standard in some ways.......anyone take the short off the lowest range 15 minute bar of the day into the 78 - 81 zone......it's all there..!!Originally posted by Piker
Triples at 1078.75 also.
According to my data, which may be bad, the triple I'm referring to occurred this morning at 7:45, 7:50, and 7:55.
YEAH, Piker, if you open up my chart above,you can see them around 7:50
Yes, the front month unless there are only a few days to expiration. And I'm looking for immediacy in the move, up or down, of decent magnitude ... preferably within 1 to 2 (sometimes 3)days. And that's if I don't have a strong directional bias ... which I don't currently ... just a mild bias to the down side which comes primarily from how individual stocks have performed in the past couple of days and how their charts currently look "heavy" for lack of a better term.
Originally posted by Piker
Originally posted by MonkeyMeat
Just an observation guys. Yeah, there's the cycle of expansion and contraction of daily bar ranges (and the same on other time frames as well) ... but, look at the SPY chart and also the ES chart that includes all trading hours. The market is likely to have a decent magnitude move out of the current range ... my hope being that tonight's trading stays narrow and that Tuesday opens inside of this range bound activity. Then it's a matter of how ya play it ... directionally or tossing on straddle or strangle option contracts ... and even potentially legging out of them. Here's hoping for continued range constriction tonight and opening into tomorrow!!
Just curious MM,
Do you use front-month contracts when you put on straddles/strangles?
Emini Day Trading /
Daily Notes /
Forecast /
Economic Events /
Search /
Terms and Conditions /
Disclaimer /
Books /
Online Books /
Site Map /
Contact /
Privacy Policy /
Links /
About /
Day Trading Forum /
Investment Calculators /
Pivot Point Calculator /
Market Profile Generator /
Fibonacci Calculator /
Mailing List /
Advertise Here /
Articles /
Financial Terms /
Brokers /
Software /
Holidays /
Stock Split Calendar /
Mortgage Calculator /
Donate
Copyright © 2004-2023, MyPivots. All rights reserved.
Copyright © 2004-2023, MyPivots. All rights reserved.

