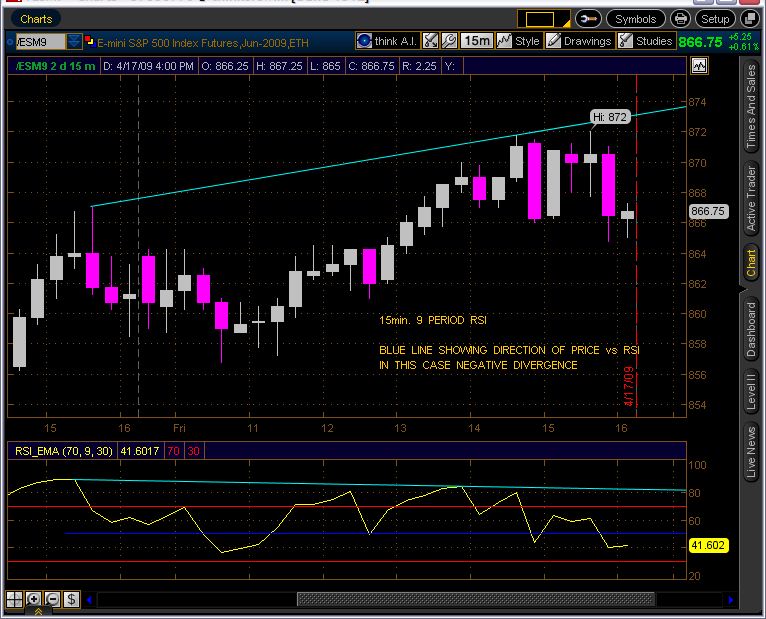
anyone trying shorts??
Up here at 845 ES....S&P is holding back this rally today...where the HECK is my plus or (hopefully) minus 8 - 10 range? has everyone gone to 24 hour trading???
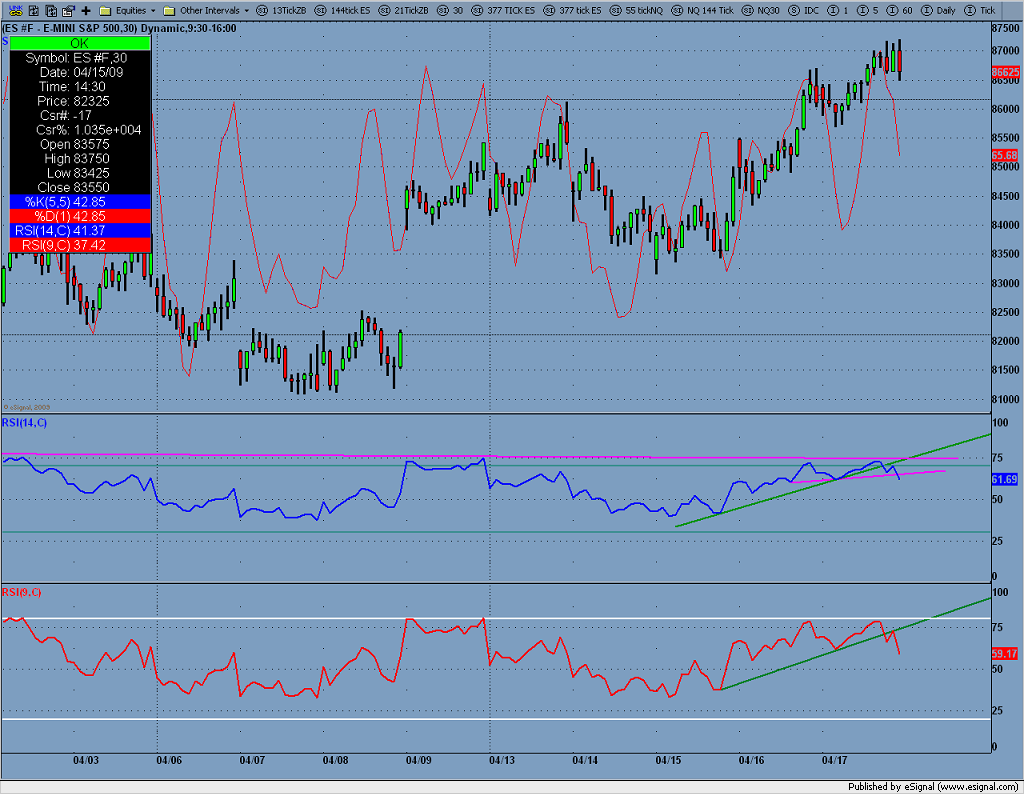
At the time I placed that short the RSI was underneath the green up trend line and knocking on it as resistance, and oversold.
Bruce;
I know I have posted more engulf than anything else, but the pattern (candle line) in the chart above is
one I have found to be the strongest in showing a turn and is my favorite. Here is what Nison says about
this pattern:
"Disrtibution / What is happening in such an enviroment is that "smart" money is thought to be distributing
their supply to meet all the buying that is entering the market."
In that 5min. candle the volume was big and the open close were the same / add to that the bears pushed down
and closed below the so9. What is needed to identify this pattern? (1) high price area (2) big volume on that
candle (3) little or no price movement / accumulation is identified at a low price area in the same way.
The larger the time frame the stronger the pattern (15/30/60/daily ect.)
KoolBlue;
I'am a big fan of your projections. I also look for the mean in s/r and projections.
I thought this was interesting from Fridays projections...853.75 + 1.618% = 867.50
853.75 + 2.618% = 876.00.....876.00 + 867.50 /2 = 871.75
I'am a big fan of your projections. I also look for the mean in s/r and projections.
I thought this was interesting from Fridays projections...853.75 + 1.618% = 867.50
853.75 + 2.618% = 876.00.....876.00 + 867.50 /2 = 871.75
Trying a long @ 863....looking for 1 point. I will stop/reverse with double below tonights low @ 862
Stop was hit now reversed...I think I am going to hold this short through to the close Monday. Short from 862 not the best price, but it'll do. I am looking for 842.
Covered all but 3 of that short, @ 850.00 SL On rest @ 862. +12 on those....
Covered @ 833.5 +28.5 on those runners. I new today would be a trend down day (due to NR7 on the daily and NR7weekly) so I took the day off away from the market to insure I would stay in.
well done Joe!!
quote:
Originally posted by BruceM
well done Joe!!
Thx Bruce,
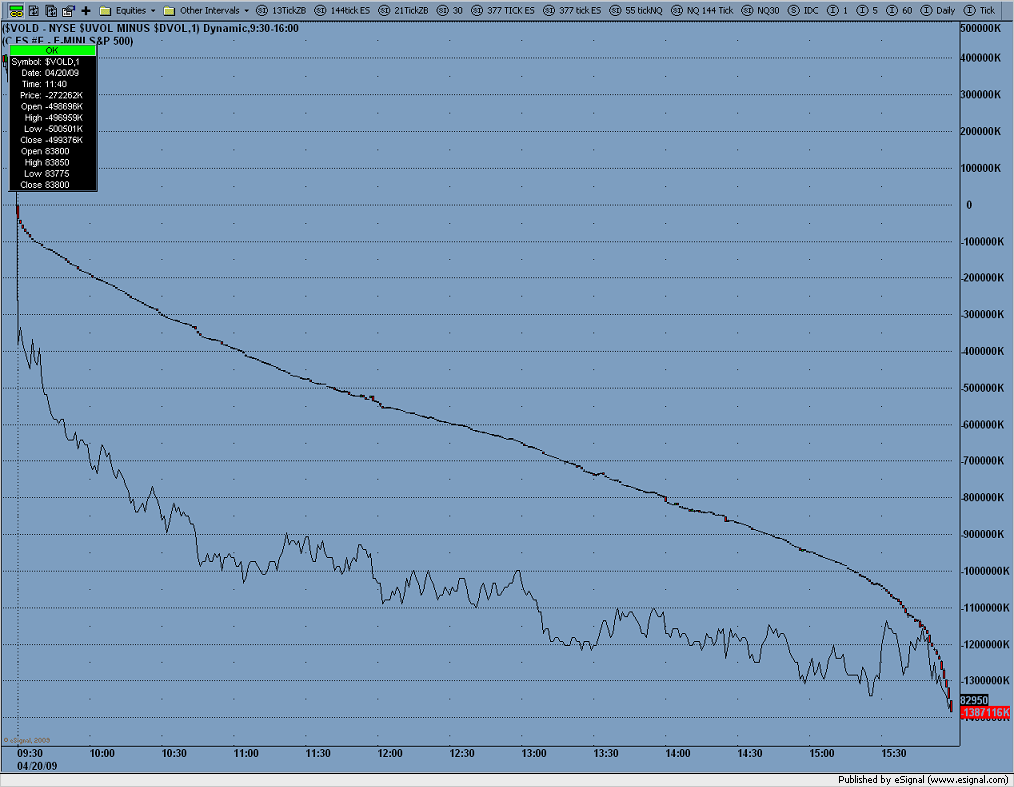
Check out this 1min chart today with your $vold. The ES is the singal black line...
- Page(s):
- 8
- 9
- 10
- 11
- 12
- 13
- 14
- 15
- 16
- 17
- 18
- 19
- 20
- 21
- 22
- 23
- 24
- 25
- 26
- 27
- 28
- 29
- 30
- 31
- 32
- 33
- 34
- 35
- 36
- 37
- 38
- 39
- 40
- 41
- 42
- 43
- 44
- 45
- 46
- 47
- 48
- 49
- 50
- 51
- 52
- 53
- 54
- 55
- 56
- 57
- 58
- 59
- 60
- 61
- 62
- 63
- 64
- 65
- 66
- 67
- 68
- 69
- 70
- 71
- 72
- 73
- 74
Just about perfect - perfectly wrong that is!
Emini Day Trading /
Daily Notes /
Forecast /
Economic Events /
Search /
Terms and Conditions /
Disclaimer /
Books /
Online Books /
Site Map /
Contact /
Privacy Policy /
Links /
About /
Day Trading Forum /
Investment Calculators /
Pivot Point Calculator /
Market Profile Generator /
Fibonacci Calculator /
Mailing List /
Advertise Here /
Articles /
Financial Terms /
Brokers /
Software /
Holidays /
Stock Split Calendar /
Mortgage Calculator /
Donate
Copyright © 2004-2023, MyPivots. All rights reserved.
Copyright © 2004-2023, MyPivots. All rights reserved.


