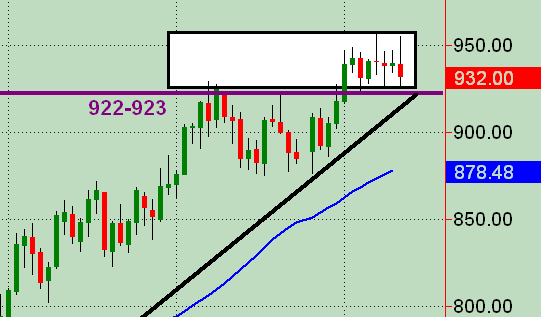
anyone trying shorts??
Up here at 845 ES....S&P is holding back this rally today...where the HECK is my plus or (hopefully) minus 8 - 10 range? has everyone gone to 24 hour trading???
- Page(s):
- 1
- 2
- 3
- 4
- 5
- 6
- 7
- 8
- 9
- 10
- 11
- 12
- 13
- 14
- 15
- 16
- 17
- 18
- 19
- 20
- 21
- 22
- 23
- 24
- 25
- 26
- 27
- 28
- 29
- 30
- 31
- 32
- 33
- 34
- 35
- 36
- 37
- 38
- 39
- 40
- 41
- 42
- 43
- 44
- 45
- 46
- 47
- 48
- 49
- 50
- 51
- 52
I still have 35 as the "magic" inflection price here as you pointed out. Wouldn't be comfortable re-shorting if it pushes up thru it.
I think today's last hour of trading will be interesting and telling as to who's really still in control for the short term ... buyers or sellers. We're still in a week+ trading range, and have reacted off the low end of that price area so far.
I think today's last hour of trading will be interesting and telling as to who's really still in control for the short term ... buyers or sellers. We're still in a week+ trading range, and have reacted off the low end of that price area so far.
Expecting (hoping?) for a stronger run up into the close ... so sold to close full position of 100cons for 12 cents ... with pre-mkt report coming out in morn. We're still in a trading range at the top of a bullish uptrend (even though signif resist in 960's) FWIW. Powder's dry ... I can sleep tonight ;-)
on a thread today I went on about how sometimes it's hard to get through to people who's opinions are ingrained in them.....very fitting for me today as I had a short opinion late in the day.....well I gave up 3.5 points of profit due to that...I admire those who can be like a "reed in the wind" and really "listen".......just like David Caradine in "Kung Fu"////WTF!!!! loved that show as a kid
and thanks for the charts Guys!!!
Ain't we all "grasshoppers" in a continuing evolution of trading with market evolution/changes over time?!? I try to be an eternal student (easier said than done). Watched "Kung Fu" also as a young 'un ... and an RIP to Mr. Caradine!
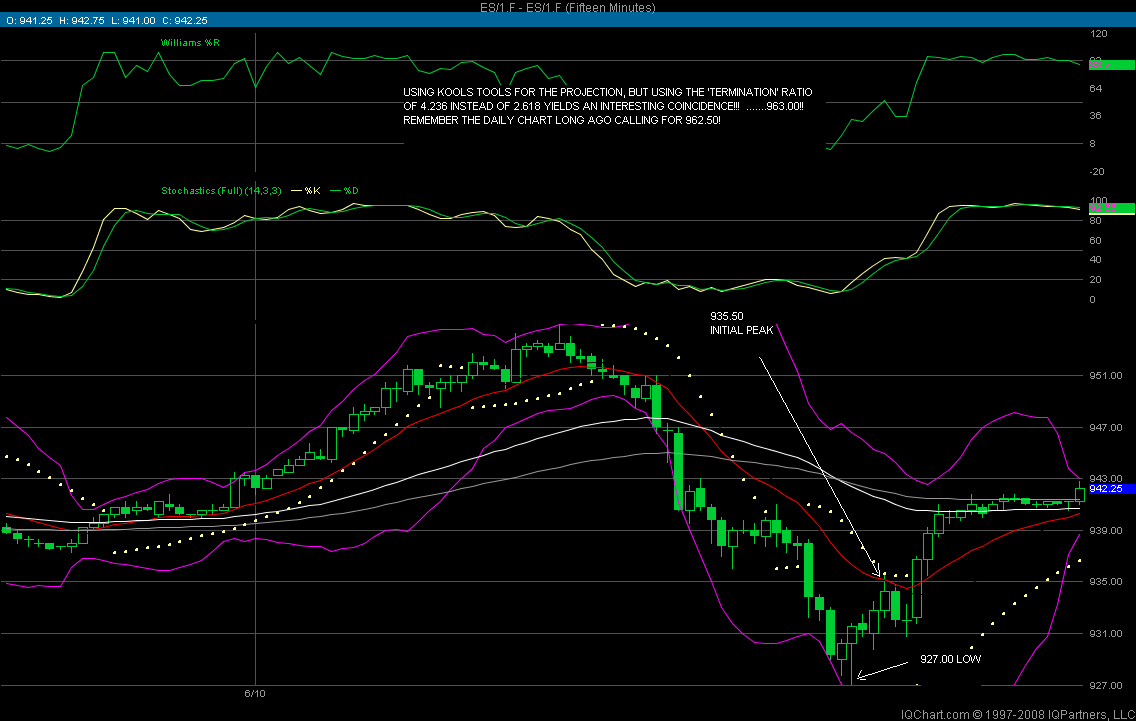
On the charts you can clearly see a running triangle down to a at 922.50, up to b at 957.50 ,down to c around 925.25, up to d at 955.00 and finally down to e at 927.00. i know im beginning to see ed's, ld's, and triangles in my sleep! Anyway, if it doesnt fail, the widest part (957.50 to 922.50) is 35 handles... and 35 plus wave e = 963!! my long awaited 963! using the apex plus 35 yields about 975 and the expected breakout(953)plus 35 would be 988. We should know tomorrow or friday for sure if this is valid at all!....
i think someone also pointed out the inverted head and shoulders on the hourly charts!
Just about perfect - perfectly wrong that is!
Emini Day Trading /
Daily Notes /
Forecast /
Economic Events /
Search /
Terms and Conditions /
Disclaimer /
Books /
Online Books /
Site Map /
Contact /
Privacy Policy /
Links /
About /
Day Trading Forum /
Investment Calculators /
Pivot Point Calculator /
Market Profile Generator /
Fibonacci Calculator /
Mailing List /
Advertise Here /
Articles /
Financial Terms /
Brokers /
Software /
Holidays /
Stock Split Calendar /
Mortgage Calculator /
Donate
Copyright © 2004-2023, MyPivots. All rights reserved.
Copyright © 2004-2023, MyPivots. All rights reserved.

