Day Trading with TTT and other tools
Welcome to this new thread, where we can share trading ideas and our thoughts on the Taylor Trading Technique.
Anyone with questions on TTT, this is the place.
Anyone with questions on TTT, this is the place.
- Page(s):
- 1
- 2
- 3
- 4
- 5
- 6
- 7
- 8
- 9
- 10
- 11
- 12
- 13
- 14
- 15
- 16
- 17
- 18
- 19
- 20
- 21
- 22
- 23
- 24
- 25
- 26
- 27
- 28
- 29
- 30
- 31
- 32
- 33
- 34
- 35
- 36
- 37
- 38
- 39
- 40
- 41
- 42
- 43
- 44
- 45
- 46
- 47
- 48
- 49
- 50
- 51
- 52
- 53
- 54
- 55
- 56
- 57
- 58
- 59
- 60
- 61
- 62
- 63
- 64
- 65
- 66
- 67
- 68
- 69
Please reduce the image size before uploading.
quote:
Originally posted by Eric
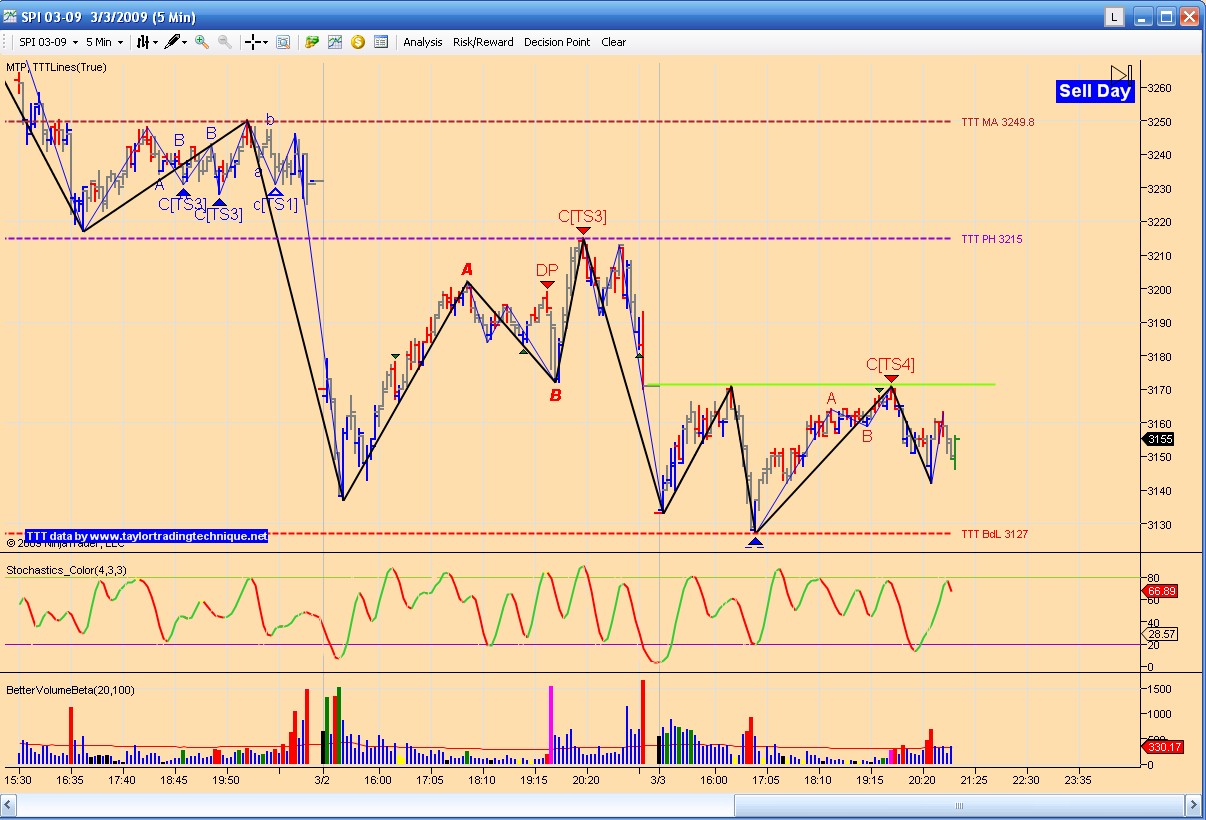
Here's a classic TTT Sell Day example on the Australian SPI futures market.
You did a great job marking that up. Good example.
Jands post was also interesting since I had never seen MTP on Tradestation before.
Great thread! I am nearly done reading it all and hope to finish it tomorrow. I am going to give the TTT a try and see if it can help my trading bias. I had never heard of MTP before and wow I got sticker shock after looking at the price tag. It is way too expensive for me.
quote:
Originally posted by wirechild
Great thread! I am nearly done reading it all and hope to finish it tomorrow. I am going to give the TTT a try and see if it can help my trading bias. I had never heard of MTP before and wow I got sticker shock after looking at the price tag. It is way too expensive for me.
Atleast there is no sticker shock on TTT
The latest version of the Add-On is now available for eSignal and Ninja Trader.
This new version now covers multiple markets all in one indicator.
The markets covered are:
US Index Futures
European Index Futures
Forex
Forex Futures
Gold and Oil Futures
Aussie Futures
also a Forex version for MT4 is available.
Visit the website for more info or email me.
This new version now covers multiple markets all in one indicator.
The markets covered are:
US Index Futures
European Index Futures
Forex
Forex Futures
Gold and Oil Futures
Aussie Futures
also a Forex version for MT4 is available.
Visit the website for more info or email me.
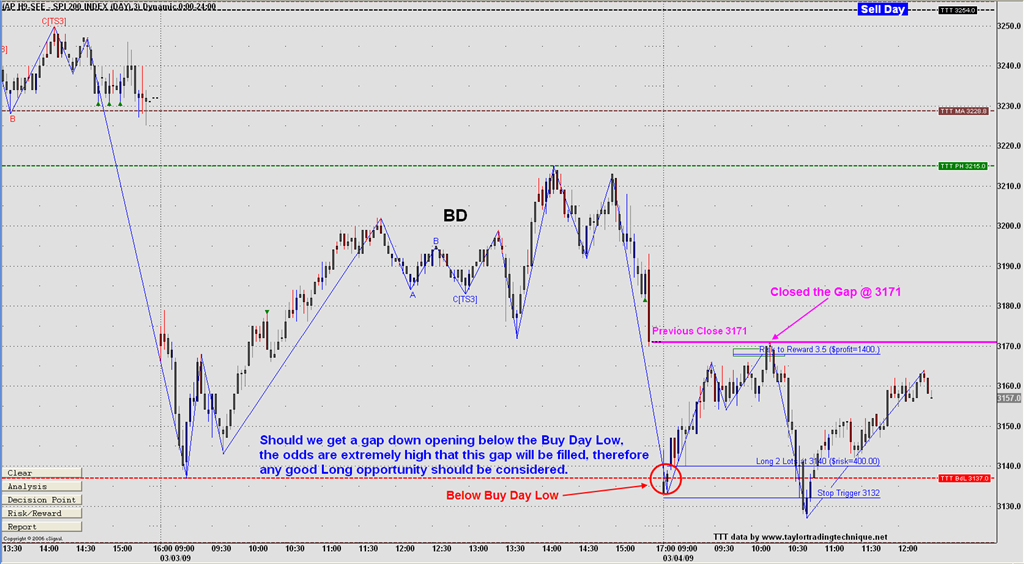
Another classic Sell Day seup straight out of Richard's e-book.
The market gapped down below the Buy Day low and then exactly closed the gap.
A manual MTP DP trade was then available for the down trend into the opposing DP level.
The market gapped down below the Buy Day low and then exactly closed the gap.
A manual MTP DP trade was then available for the down trend into the opposing DP level.
I agree Eric and I often like to use 1 chart on day numbers and one on 24H numbers. This picture shows you why I like both
Congrats on a Nice Trade
Congrats on a Nice Trade
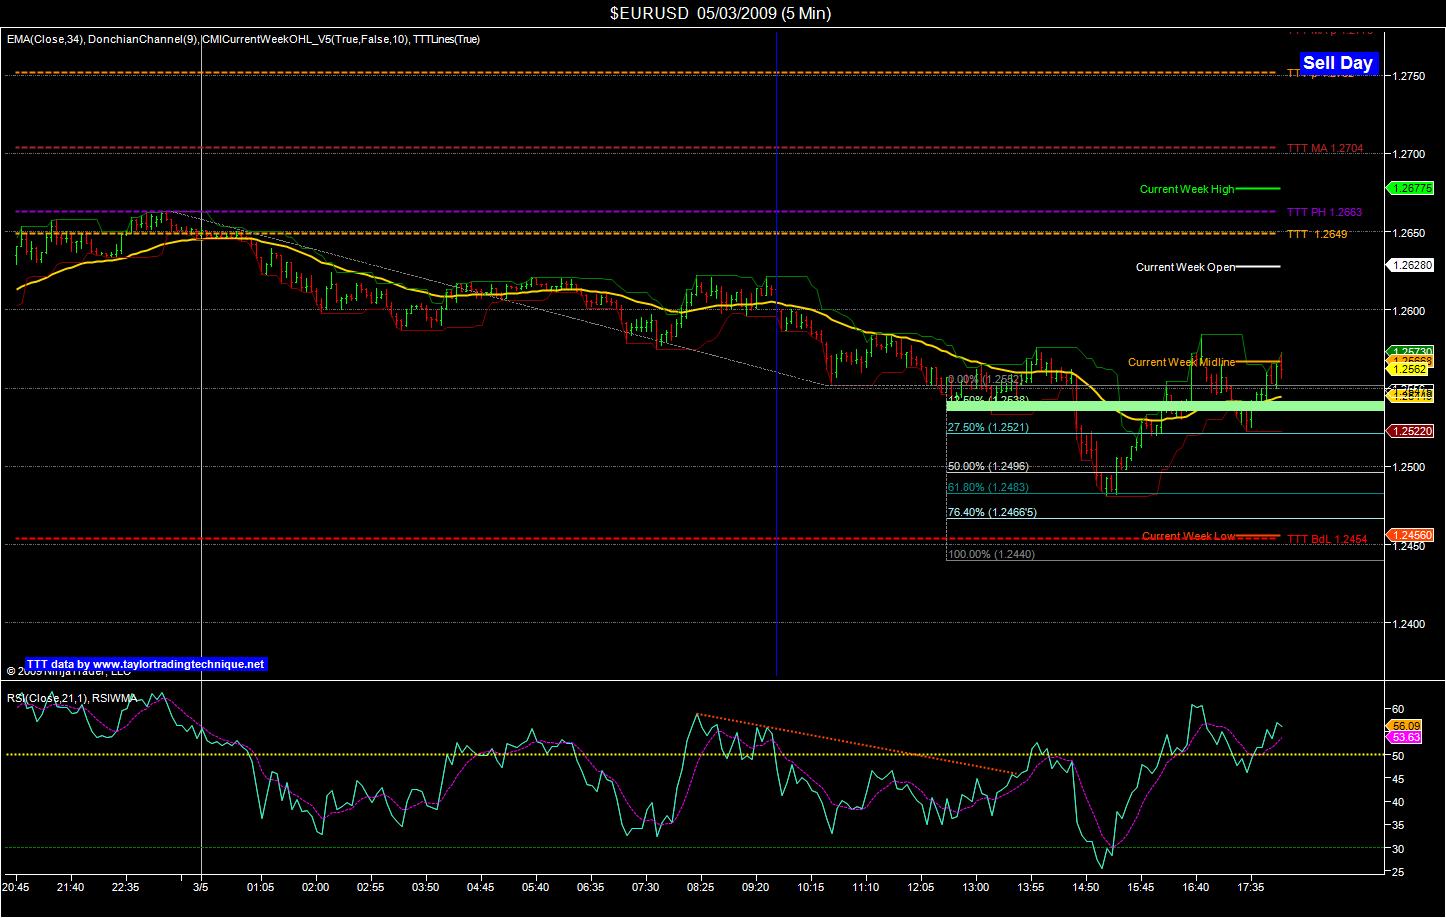
Rich - total TTT newbie first post : would you please give a very brief overview of today's EURUSD Sell Day chart ?
Yesterday's High was shortly before the Close, indicating a possibile continuation rally and penetration today, which of course has not occurred. How would you have used the TTT data to approach today, please ? Times on my chart are CET and of course the day has about another 6 hours to the NY close. Blue vertical line marks my sell based on RSI divergence with double top of price. The green band is my personal "DP" using a Fib Extension (not retracement). I have changed to OHLC bars to scrunch up the chart to get the whole day in without it being too big...
J.
quote:
Originally posted by jtrade
Rich - total TTT newbie first post : would you please give a very brief overview of today's EURUSD Sell Day chart ?
Yesterday's High was shortly before the Close, indicating a possibile continuation rally and penetration today, which of course has not occurred. How would you have used the TTT data to approach today, please ? Times on my chart are CET and of course the day has about another 6 hours to the NY close. Blue vertical line marks my sell based on RSI divergence with double top of price. The green band is my personal "DP" using a Fib Extension (not retracement). I have changed to OHLC bars to scrunch up the chart to get the whole day in without it being too big...
J.
Today is a sell day. The rally occured on the Buy day, since the low was made first and reached the average projected rally. When the market changed day since it never stops, it was at these levels. So it didnt make a penetration and then corrected that up move.
Sell days are often confused day going both directions
[/quote]
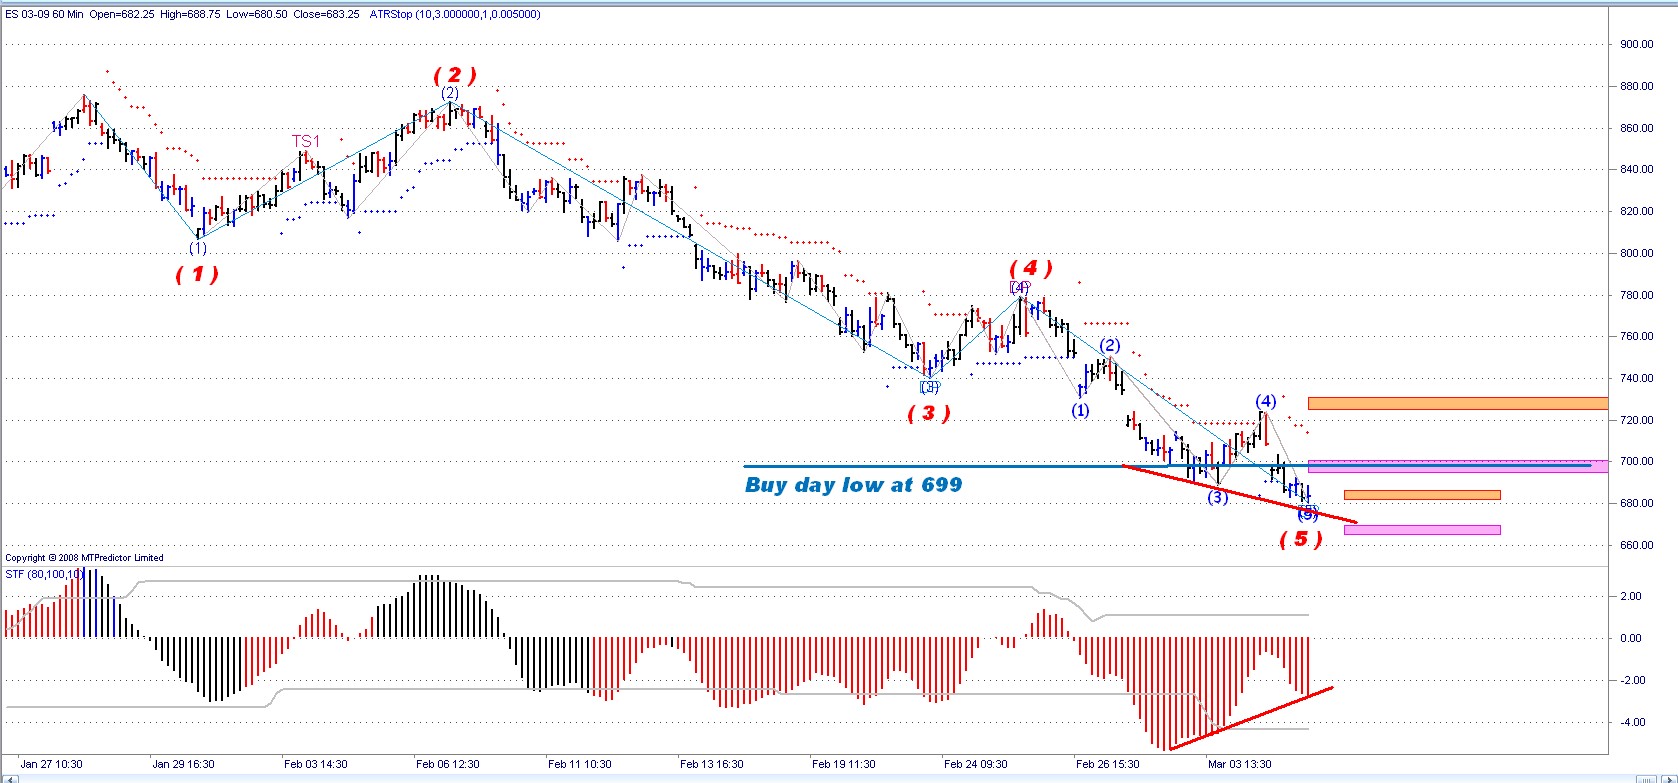
Tomorrow is a SS day and should be interesting as we have 81% chance of getting at least above the Buy Day Low.
Now V6 found these waves and we 5 waves in wave 5. So that should help for some rally
We shall see tomorrow.
Now V6 found these waves and we 5 waves in wave 5. So that should help for some rally
We shall see tomorrow.
- Page(s):
- 71
- 72
- 73
- 74
- 75
- 76
- 77
- 78
- 79
- 80
- 81
- 82
- 83
- 84
- 85
- 86
- 87
- 88
- 89
- 90
- 91
- 92
- 93
- 94
- 95
- 96
- 97
- 98
- 99
- 100
- 101
- 102
- 103
- 104
- 105
- 106
- 107
- 108
- 109
- 110
- 111
- 112
- 113
- 114
- 115
- 116
- 117
- 118
- 119
- 120
- 121
- 122
- 123
- 124
- 125
- 126
- 127
- 128
- 129
- 130
- 131
- 132
- 133
- 134
- 135
- 136
- 137
- 138
- 139
- 140
- 141
- 142
- 143
- 144
- 145
- 146
- 147
- 148
- 149
- 150
- 151
- 152
I hope all you TTT traders had a good 2014 and I wish you all a better 2015
Richard
Richard
Emini Day Trading /
Daily Notes /
Forecast /
Economic Events /
Search /
Terms and Conditions /
Disclaimer /
Books /
Online Books /
Site Map /
Contact /
Privacy Policy /
Links /
About /
Day Trading Forum /
Investment Calculators /
Pivot Point Calculator /
Market Profile Generator /
Fibonacci Calculator /
Mailing List /
Advertise Here /
Articles /
Financial Terms /
Brokers /
Software /
Holidays /
Stock Split Calendar /
Mortgage Calculator /
Donate
Copyright © 2004-2023, MyPivots. All rights reserved.
Copyright © 2004-2023, MyPivots. All rights reserved.


