Running the Triples
Here is more of a strategy than a specific setup . It addresses the markets efficiency and potential failures. I usually do not trade against this as they get taken out almost 90% of the time on the same day....here it is...a simple idea but one that I have never seen written about....if I where Larry Williams I would attatch my name to it..lol...these are much more valid then double 5 minute bars
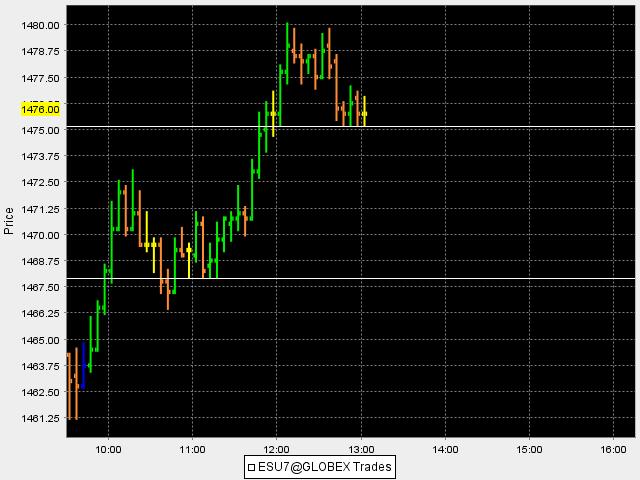
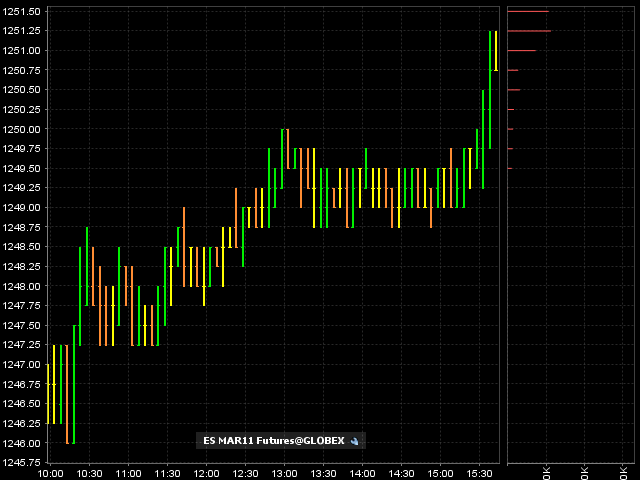
When you have three, 5 minute bars in a row with a matching low or high that low or high will get traded back to on the same day. I'll post more charts from the past week or so later but here are todays that haven't been traded back to.
There currently exists two of these area in the market at 75.25 and down at the 67 area.....the market is at 1478.75..these basically develop in low volume environments and when the probability fails they become great reference points for targets....more later..here is the current chart...I'm looking to get short...
First time reading this thread. I'll be watching the charts to see hows it goes. Have you been successful IE making money with this strategy? Thanks for sharing BruceM.
yes, but best to use the triples as targets especially if they DON"T fall near the highs and lows of the day
Bruce,
On 7/08 the ES formed a triple print @ 12:30 it then went a tick lower the next bar. The market then rallied to 874 and made another triple then traded back below the original triple. My question is did that one tick below the low of the triple make it void (12:35 bar)?
On 7/08 the ES formed a triple print @ 12:30 it then went a tick lower the next bar. The market then rallied to 874 and made another triple then traded back below the original triple. My question is did that one tick below the low of the triple make it void (12:35 bar)?
Thanks for sharing bruce.
Could you post a chart Joe ? My IB data doesn't show the 5 minute bars that far back.....Not sure what you mean by "Void" also ...the basic premise is that stops sit above and below when we have three , 5 minute bars in a row with a matching top or bottom and the floor knows and sees that...so they go to run them out......we can now see how they cleaned up the triples made on this past fridays trade near the lows in the current overnight session.........
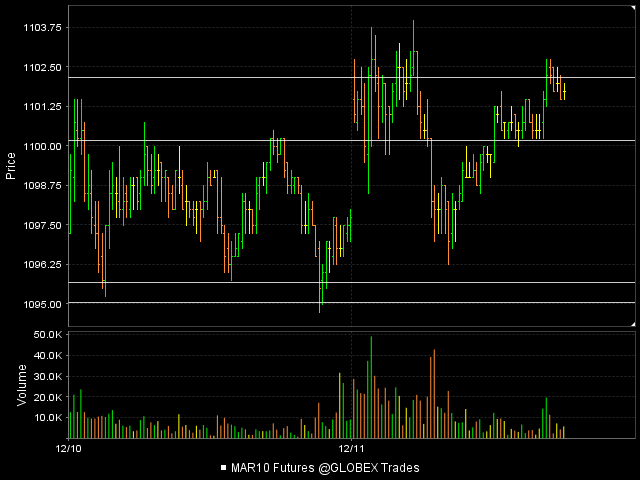
here is a cool chart showing how all triples ( up until this post ) except one have been run out the last two days.......one currently exists at 1100.25
well, my chart came out crappy but there were 11 sets of triples run out......does it pay to know they exists..? you be the judge
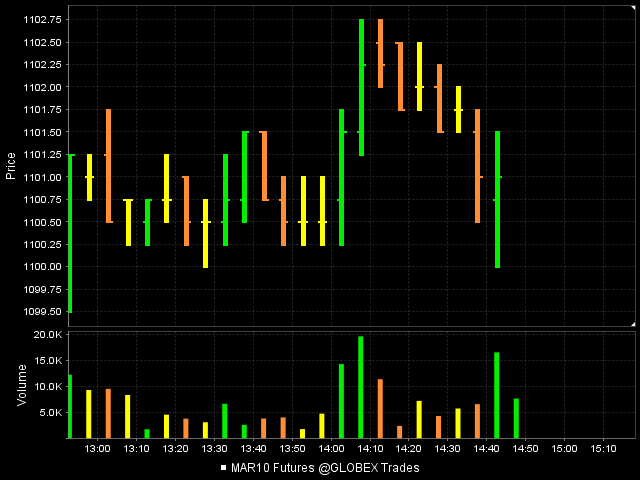
here is the last run...it was actually 4 ( 5 minute) bars in a row.....beautiful
The past month has created more triples then I have ever seen on the charts. Not surprising as we are in a low volume trading environment and that is where triples get created. Many are not getting filled on the same trading day but become excellent targets for the next 1 - 3 days.
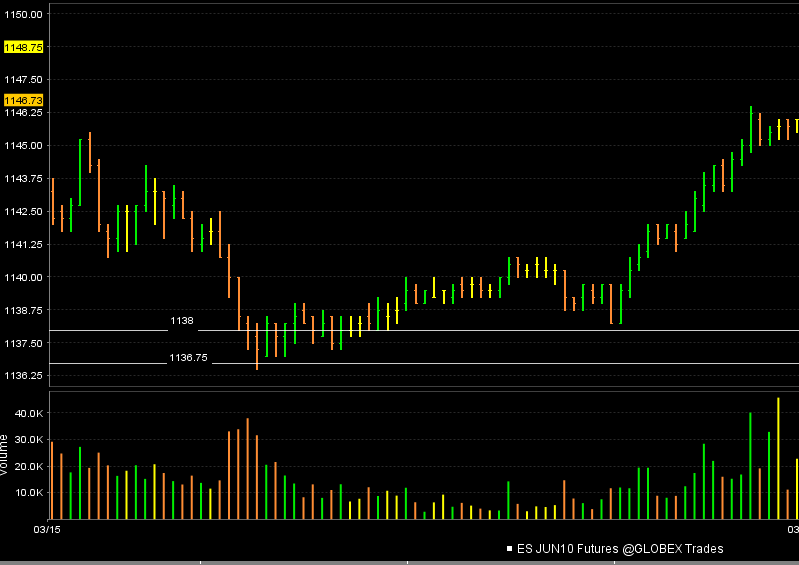
On Thursday, 3-11-10 we rolled over to the June contract and that created triples at 1136.75 and 1138. I have these lines snapped on the chart below. This past Monday they cleaned them up and rallied from there. This is Mondays chart with the Triples marked from Thursdays trade. You should also take note of the triples that formed again at the 1138 area and those that still exist at 1143.25 from Mondays trade. Incredible how efficient these market are. There is also a gap at 1141.25 that you may be able to see.
The point really is that they know where people gauge their stops and above and below triples is so obvious. We need to trade for them to be broken.
looks like we're setting up triples @ 1162.50
A look at the triple festival from 12-21 trade...this is bad stuff and doesn't stay in the market long before they get run out.....many times these get clobbered in the overnight trade. Volume has been unusually low so triples form all over the place and become unreliable and risky SHORT TERM daytrading targets but great for a longer term bias.
You can expect to see gaps way beyond these areas in the RTH session and most likely soon. In other words, I would be careful on any long trades up here.
You can expect to see gaps way beyond these areas in the RTH session and most likely soon. In other words, I would be careful on any long trades up here.
Emini Day Trading /
Daily Notes /
Forecast /
Economic Events /
Search /
Terms and Conditions /
Disclaimer /
Books /
Online Books /
Site Map /
Contact /
Privacy Policy /
Links /
About /
Day Trading Forum /
Investment Calculators /
Pivot Point Calculator /
Market Profile Generator /
Fibonacci Calculator /
Mailing List /
Advertise Here /
Articles /
Financial Terms /
Brokers /
Software /
Holidays /
Stock Split Calendar /
Mortgage Calculator /
Donate
Copyright © 2004-2023, MyPivots. All rights reserved.
Copyright © 2004-2023, MyPivots. All rights reserved.
