Running the Triples
Here is more of a strategy than a specific setup . It addresses the markets efficiency and potential failures. I usually do not trade against this as they get taken out almost 90% of the time on the same day....here it is...a simple idea but one that I have never seen written about....if I where Larry Williams I would attatch my name to it..lol...these are much more valid then double 5 minute bars
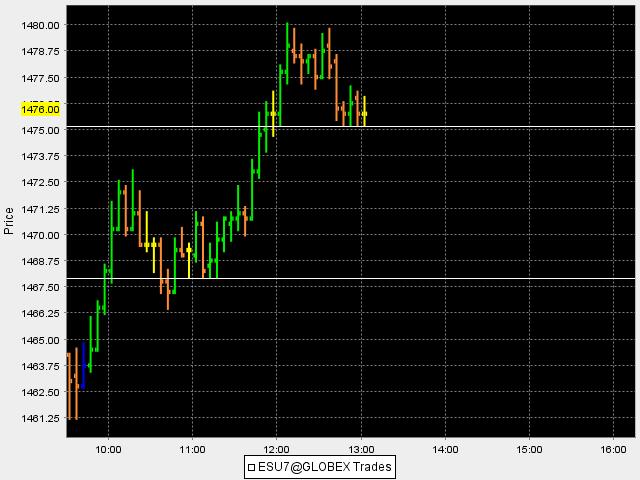
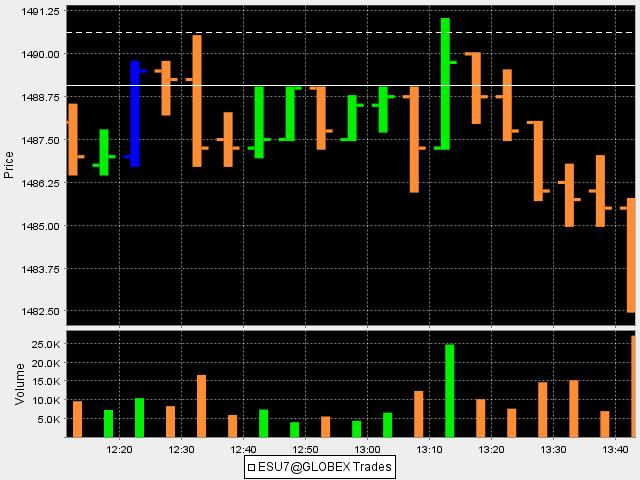
When you have three, 5 minute bars in a row with a matching low or high that low or high will get traded back to on the same day. I'll post more charts from the past week or so later but here are todays that haven't been traded back to.
There currently exists two of these area in the market at 75.25 and down at the 67 area.....the market is at 1478.75..these basically develop in low volume environments and when the probability fails they become great reference points for targets....more later..here is the current chart...I'm looking to get short...
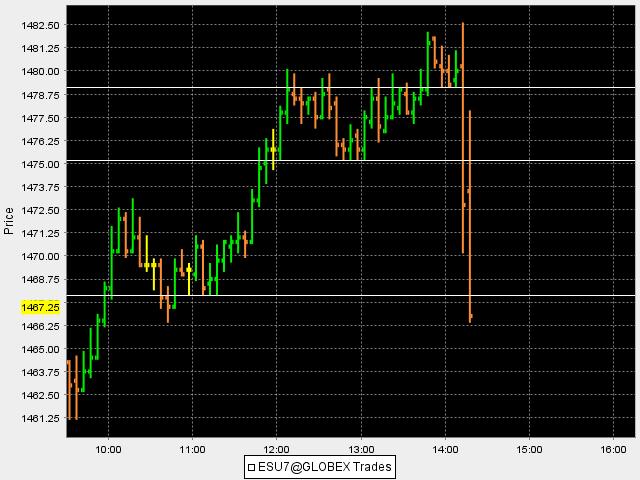
I hope you can now see why I wasn't a buyer...for me it was selling all the way...I drew in one more horizontal line as 3 (5 minute bars ) formed just before the Fed announcement..at 1479.....so short was the way to go....I'll post some other charts later..they cleaned all the stops out waiting behind those bars.....
I wanted to try and post this concept as I traded for it and I can say that "trading and posting" at the same time sucks. I'll leave that for the vendors! Too stressful....anyway here is the chart after they "ran out the triples". If anyone can find where this is written about then please let me know so I can give credit where it is due. Otherwise I'll apply for the rights!!
Bruce
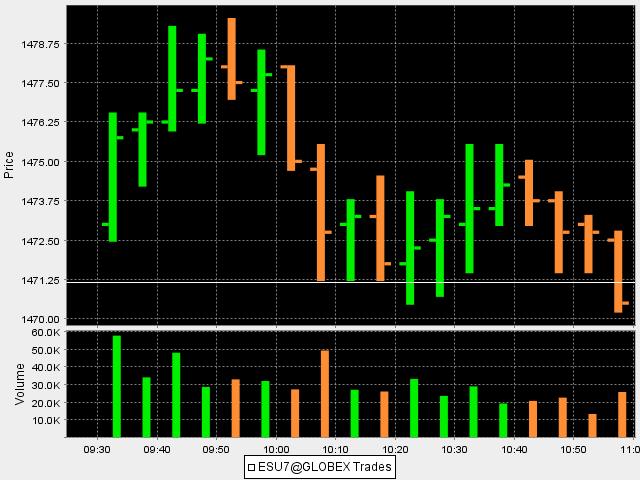
some examples....from the last two weeks or so..
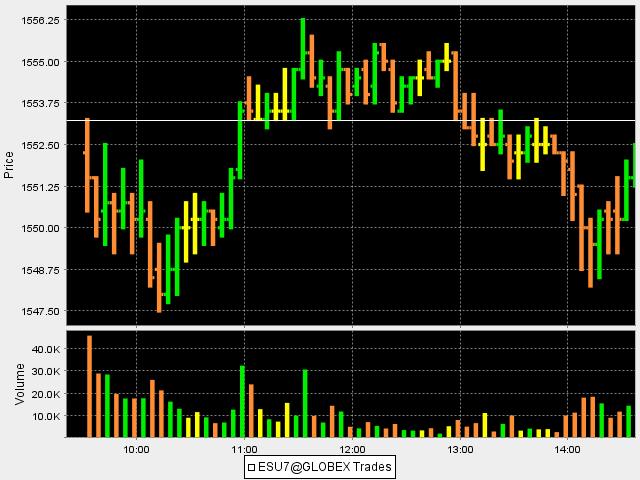
Heres a beauty from todays trading......we had three 5 minute bars with matching lows just around the 10:30 time frame...they came back to take them out...
Bruce
Bruce
It is curious...
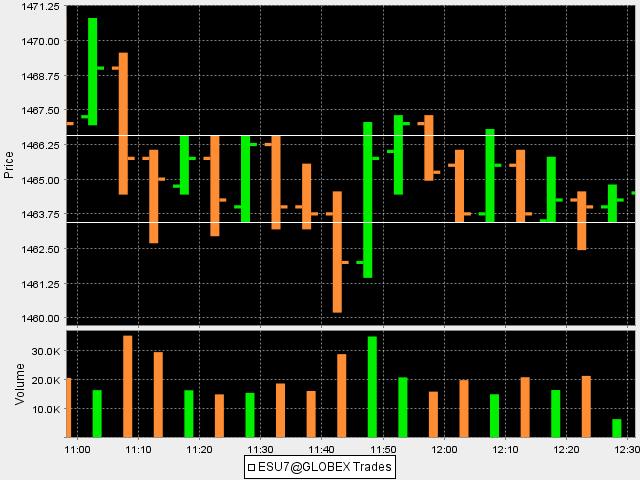
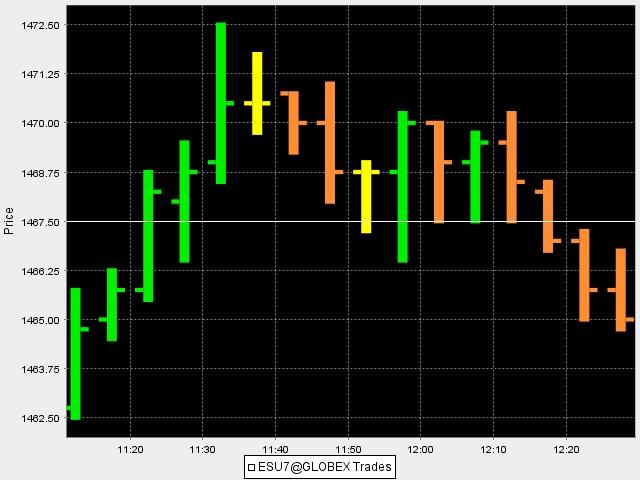
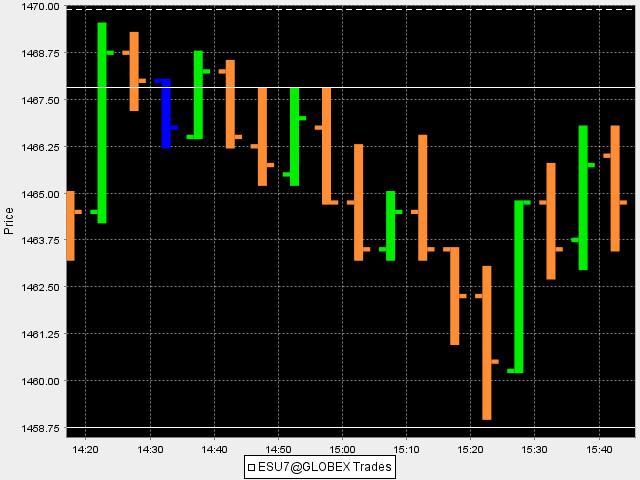
Here's some from yesterday...I wanted to post a good one and a failure....they tried but just couldn't push it up to take them out.....interesting that they both formed around the 1467.50 price
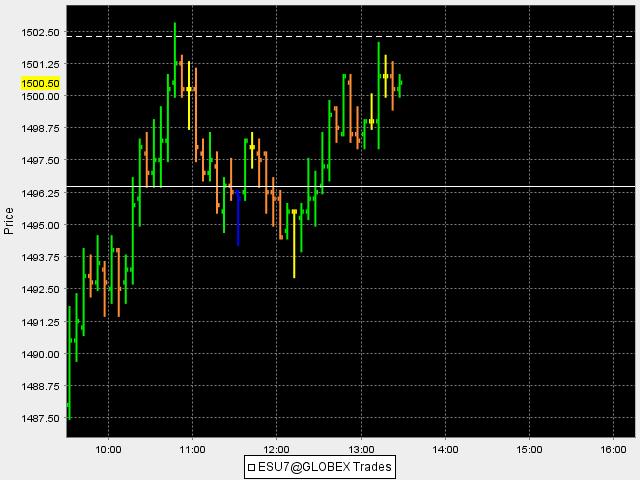
Here are two sets from todays trade...notice how the first set ( formed at around 12:15 )of triples became resistance......the second set formed at around 2- 2:15 .....cool stuff.....
BruceM,
Do you have any criteria for how far from a triple you want to see it move before you consider it a trade back to the triple? What I am getting at is, say it moves a small amount away and shortly after trades back. Then later it moves quite a bit away. Would you still expect with equal likelihood that it will trade back to it, or has it already been 'used up', so to speak. I know I will be able to get my own estimate on this with further observation, but if you have any ideas, I'd love to hear them. Thanks.
Do you have any criteria for how far from a triple you want to see it move before you consider it a trade back to the triple? What I am getting at is, say it moves a small amount away and shortly after trades back. Then later it moves quite a bit away. Would you still expect with equal likelihood that it will trade back to it, or has it already been 'used up', so to speak. I know I will be able to get my own estimate on this with further observation, but if you have any ideas, I'd love to hear them. Thanks.
BruceM,
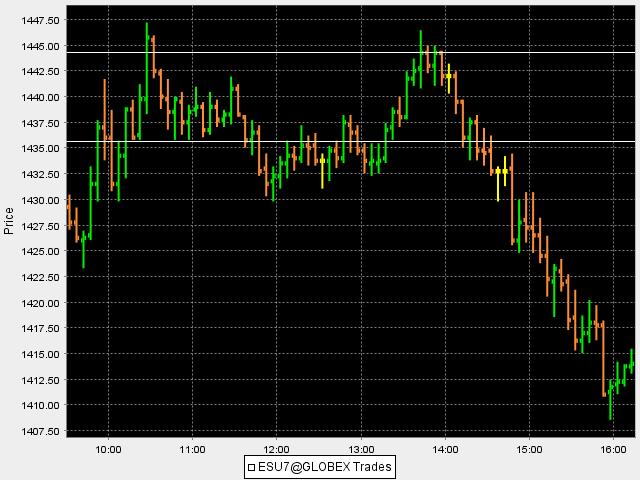
I noticed a triple top on the 13:05, 13:10 and 13:15 bars (todays chart 8/15/2007) @ 1435.25 then rallied to 1446.25 and promptly came back down to trade through 1435.25 on the 14:20 bar. Very interesting concept you have come up with.
P.S. I am new to this forum and really enjoy your informative posts! Where do you normally enter a position after seeing a triple top or bottom?
Regards
Sorry Jim but I have no specific point value. I use this as a filter to know which side I should be looking for trade setups in general. I haven't done much back testing on this but consider a triple "used up" if it is broken by even one tic. I no-longer keep my eye on that area after they are run but posting the charts here lately has made me think that maybe I should.
I prefer to see the triple area sit in the market for at least 30 minutes and those who have supported the area think they have been rewarded. Then the market comes back and takes out their stops.
It would be a cool piece of information to have if we knew that a triple that is traded away from by 8 points for example has a 60% chance of being traded to while one that is 6 points away may have an 80%....that is obviously an area of further research.
Bruce
quote:
Originally posted by jimkane
BruceM,
Do you have any criteria for how far from a triple you want to see it move before you consider it a trade back to the triple? What I am getting at is, say it moves a small amount away and shortly after trades back. Then later it moves quite a bit away. Would you still expect with equal likelihood that it will trade back to it, or has it already been 'used up', so to speak. I know I will be able to get my own estimate on this with further observation, but if you have any ideas, I'd love to hear them. Thanks.
Hi Trade4dough and welcome to the forum. I'm sorry but I can't give you a specific answer to your question as I am a discretionary trader and usually fade support or resistance. I usually like to have a price chart pattern confirm a trade if it falls outside of the first 90 minutes of trading. I like to trade for the triples when they have moved away from the market for 30 minutes and have some profit potential. I get disappointed when they are broken right away after the third bar has completed.
You have already noticed that some triples are better then others and provide more profit potential based on how they form and the reaction to them. Nice call at spotting todays. I didn't get to trade or watch the markets today but noticed something interesting as my lines from Tuesdays trade where left on the chart for today ( wednesdays session). Both of the triples that formed on Tuesday coincided with the Value area low and the point of control found on the Daily Notes page. These are generated from price and time and disregard actual trade volume. If I have a chance I'll run off a volume profile to see if there was unusual high volume at the area of the triples.I would assume so based on the point of control falling there.
Here is Wednesdays session with the lines left over from the triples on Tuesday. Hope that makes sense. You can also see where the triples where that you spotted. Thanks for the reply. Lots of cool stuff on this forum.
quote:
Originally posted by trade4dough
BruceM,
I noticed a triple top on the 13:05, 13:10 and 13:15 bars (todays chart 8/15/2007) @ 1435.25 then rallied to 1446.25 and promptly came back down to trade through 1435.25 on the 14:20 bar. Very interesting concept you have come up with.
P.S. I am new to this forum and really enjoy your informative posts! Where do you normally enter a position after seeing a triple top or bottom?
Regards
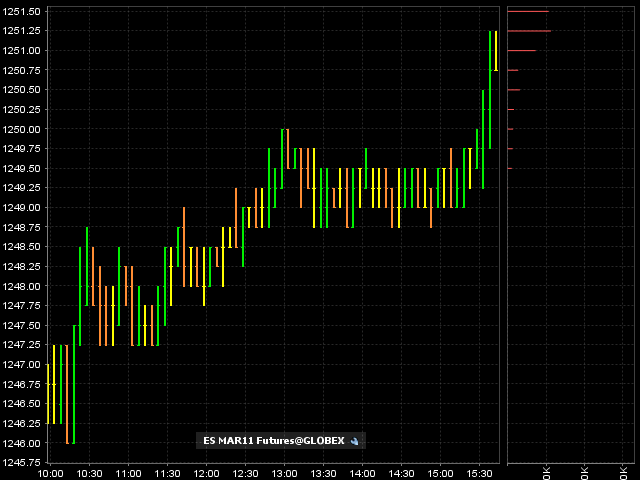
A look at the triple festival from 12-21 trade...this is bad stuff and doesn't stay in the market long before they get run out.....many times these get clobbered in the overnight trade. Volume has been unusually low so triples form all over the place and become unreliable and risky SHORT TERM daytrading targets but great for a longer term bias.
You can expect to see gaps way beyond these areas in the RTH session and most likely soon. In other words, I would be careful on any long trades up here.
You can expect to see gaps way beyond these areas in the RTH session and most likely soon. In other words, I would be careful on any long trades up here.
Emini Day Trading /
Daily Notes /
Forecast /
Economic Events /
Search /
Terms and Conditions /
Disclaimer /
Books /
Online Books /
Site Map /
Contact /
Privacy Policy /
Links /
About /
Day Trading Forum /
Investment Calculators /
Pivot Point Calculator /
Market Profile Generator /
Fibonacci Calculator /
Mailing List /
Advertise Here /
Articles /
Financial Terms /
Brokers /
Software /
Holidays /
Stock Split Calendar /
Mortgage Calculator /
Donate
Copyright © 2004-2023, MyPivots. All rights reserved.
Copyright © 2004-2023, MyPivots. All rights reserved.
