Running the Triples
Here is more of a strategy than a specific setup . It addresses the markets efficiency and potential failures. I usually do not trade against this as they get taken out almost 90% of the time on the same day....here it is...a simple idea but one that I have never seen written about....if I where Larry Williams I would attatch my name to it..lol...these are much more valid then double 5 minute bars
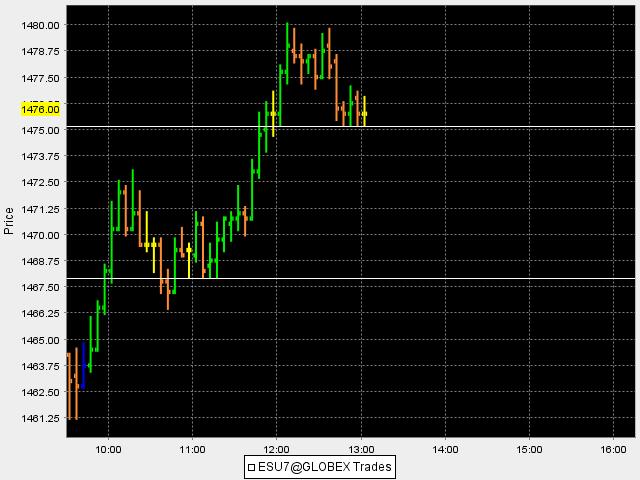
When you have three, 5 minute bars in a row with a matching low or high that low or high will get traded back to on the same day. I'll post more charts from the past week or so later but here are todays that haven't been traded back to.
There currently exists two of these area in the market at 75.25 and down at the 67 area.....the market is at 1478.75..these basically develop in low volume environments and when the probability fails they become great reference points for targets....more later..here is the current chart...I'm looking to get short...
BruceM,
Another triple bottom today at 10:50, 10:55 and 11:00 @ 1397.00 which then ran up to 1486.75 on the 11:15 bar and promptly reversed to take out the 1397 triple and then some.
Very neat stuff!
Another triple bottom today at 10:50, 10:55 and 11:00 @ 1397.00 which then ran up to 1486.75 on the 11:15 bar and promptly reversed to take out the 1397 triple and then some.
Very neat stuff!
This will be my last "triples" post with charts as I think most get the idea by now. This was always meant to be an observation more than a particular setup but they're good to keep track of.
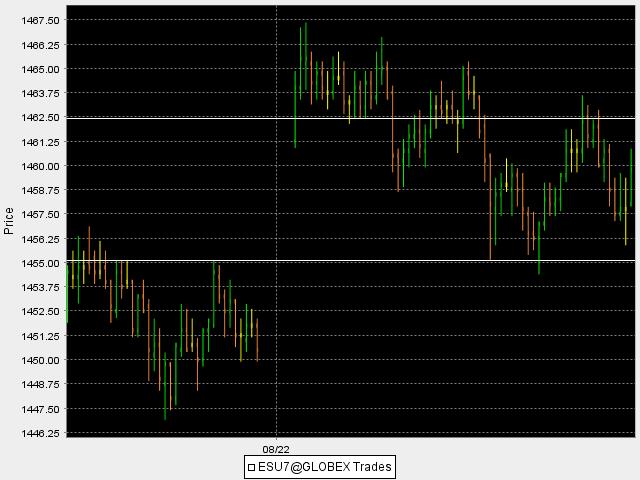
On Tuesday we had triple tops that formed at the 1455 area.....the market went further down and then came back to test them to the tic without breaking them. The interesting thing is that on Wednesday we gapped higher on the open and the triple tops from Tuesday became support.
You can also see how the triples that formed on Wednesday (8/22/07)at the 1462.50 area got taken out and then later became resistance in the afternoon. Here is the chart that shows both:
Now we move to todays trading.....you may have noticed that the last 15 minutes of Wednesdays trade had 3 matching bottoms at 1467.75..these were obvious triples. Today ( Thursday) we had a great gap open higher and then they brought the market down to run out the triples..you may notice how it became resistance later on too...I missed getting this run out of the triples myself but I wanted to draw your attention to them.
I think the market will move a certain amount of points through a support or resistance number before it becomes "Valid". I like 2.5 and 5 points. An Idea taken from William H. Greenspan (the floor trader..no relation)..and modified from observation.
Bruce
Bruce, definitely interesting and food for future research. I presume this applies to other products as well. My platform is down right now and I can't check.
Hi Steve,
I've never checked other markets and I'd be interested to find out what your research uncovers. Let us know when you have time if you don't mind sharing. Thanks
Bruce
I've never checked other markets and I'd be interested to find out what your research uncovers. Let us know when you have time if you don't mind sharing. Thanks
Bruce
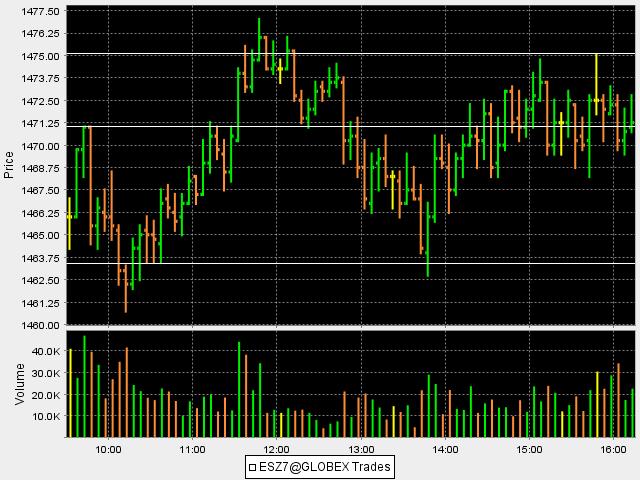
Here was a cool trade from today..I sold the break of the hour highs, got three points and then got stopped on runners. I then sold into the high from yesterday and added once we went to 150% of the IB up at the 1476 area. We also have the key number of 1475 ( and it's window) but that is not as important to me. The real point of this was that I "knew" not to be long this market.
We had the triples sitting below at 1463.50. That was my "trade of the day" I covered most on the retest of the hour high but was able to hold two contracts for the triple run at 1463.50.They missed my stop by three ticks and they obviously knew that they owed me from yesterdays loss.
We all remember how much the market plays with that line at the hour highs and the previous days highs don't we? See what happened once they took out the triples?
Questions I ask myself:
They broke the hour high does any new buying appear to be coming in?
They broke the RTH high of yesterday and does anybody appear to want to buy at these high prices.
I think many will trade breakouts from these points and sometimes they win.
Here is a chart that has 3 horizontal lines. The triples at 1463.50 and then I have the hour high and yesterdays RTH high marked off.
Perhaps I should have put this in a new thread such as "putting the pieces together". Oh well, this will do.
Bruce
Great stuff Bruce - thanks!
Bruce it is known as the Rule of 4 and I believe I am correct in that it was john Murphy who took the concept from Edwards and Magee
the principle behind the rule of 4 states that 3 tests is a charm but the 4th should crack. it can be used as a very precise entry in initially fading the market with a very tight stop and reverse. if it works and results in 3 consecutive bars that fail to extend then perfect trade location is afforded and if it fails well the stop and reverse gives you another opportunity to play the momentum trade
I believe he was talking about tests of trendlines and not 5 minute bars that have matching highs or lows.....as I have described....this is quite different...please let me know what specific text and or pages your are referring to ...I use these as targets with the Emini S&P contract and will usually be in long before they "Crack"... I haven't applied for a trademark yet ( LOL) but I'd be more than glad to give credit where it is due.
quote:
Originally posted by alleyb
the principle behind the rule of 4 states that 3 tests is a charm but the 4th should crack. it can be used as a very precise entry in initially fading the market with a very tight stop and reverse. if it works and results in 3 consecutive bars that fail to extend then perfect trade location is afforded and if it fails well the stop and reverse gives you another opportunity to play the momentum trade
just a quick update to the triples...after observing and trading for these for a few years now the ones that don't get traded back to happen near the high or low of the day usually. Many times you will see a consolidation day and a "D" shaped profile. Those are the days you want to take trades only in their direction....
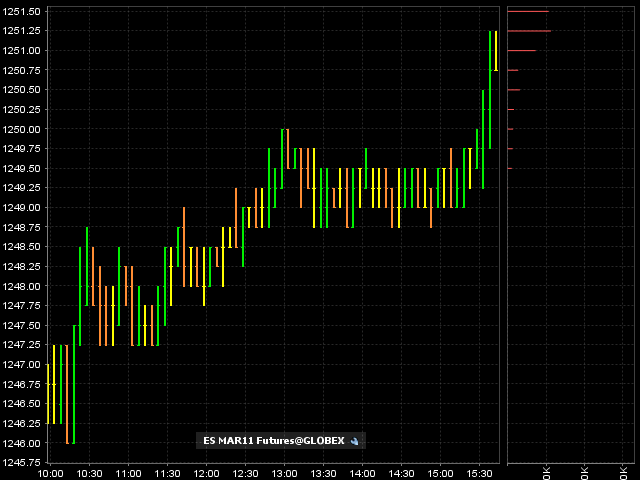
A look at the triple festival from 12-21 trade...this is bad stuff and doesn't stay in the market long before they get run out.....many times these get clobbered in the overnight trade. Volume has been unusually low so triples form all over the place and become unreliable and risky SHORT TERM daytrading targets but great for a longer term bias.
You can expect to see gaps way beyond these areas in the RTH session and most likely soon. In other words, I would be careful on any long trades up here.
You can expect to see gaps way beyond these areas in the RTH session and most likely soon. In other words, I would be careful on any long trades up here.
Emini Day Trading /
Daily Notes /
Forecast /
Economic Events /
Search /
Terms and Conditions /
Disclaimer /
Books /
Online Books /
Site Map /
Contact /
Privacy Policy /
Links /
About /
Day Trading Forum /
Investment Calculators /
Pivot Point Calculator /
Market Profile Generator /
Fibonacci Calculator /
Mailing List /
Advertise Here /
Articles /
Financial Terms /
Brokers /
Software /
Holidays /
Stock Split Calendar /
Mortgage Calculator /
Donate
Copyright © 2004-2023, MyPivots. All rights reserved.
Copyright © 2004-2023, MyPivots. All rights reserved.


