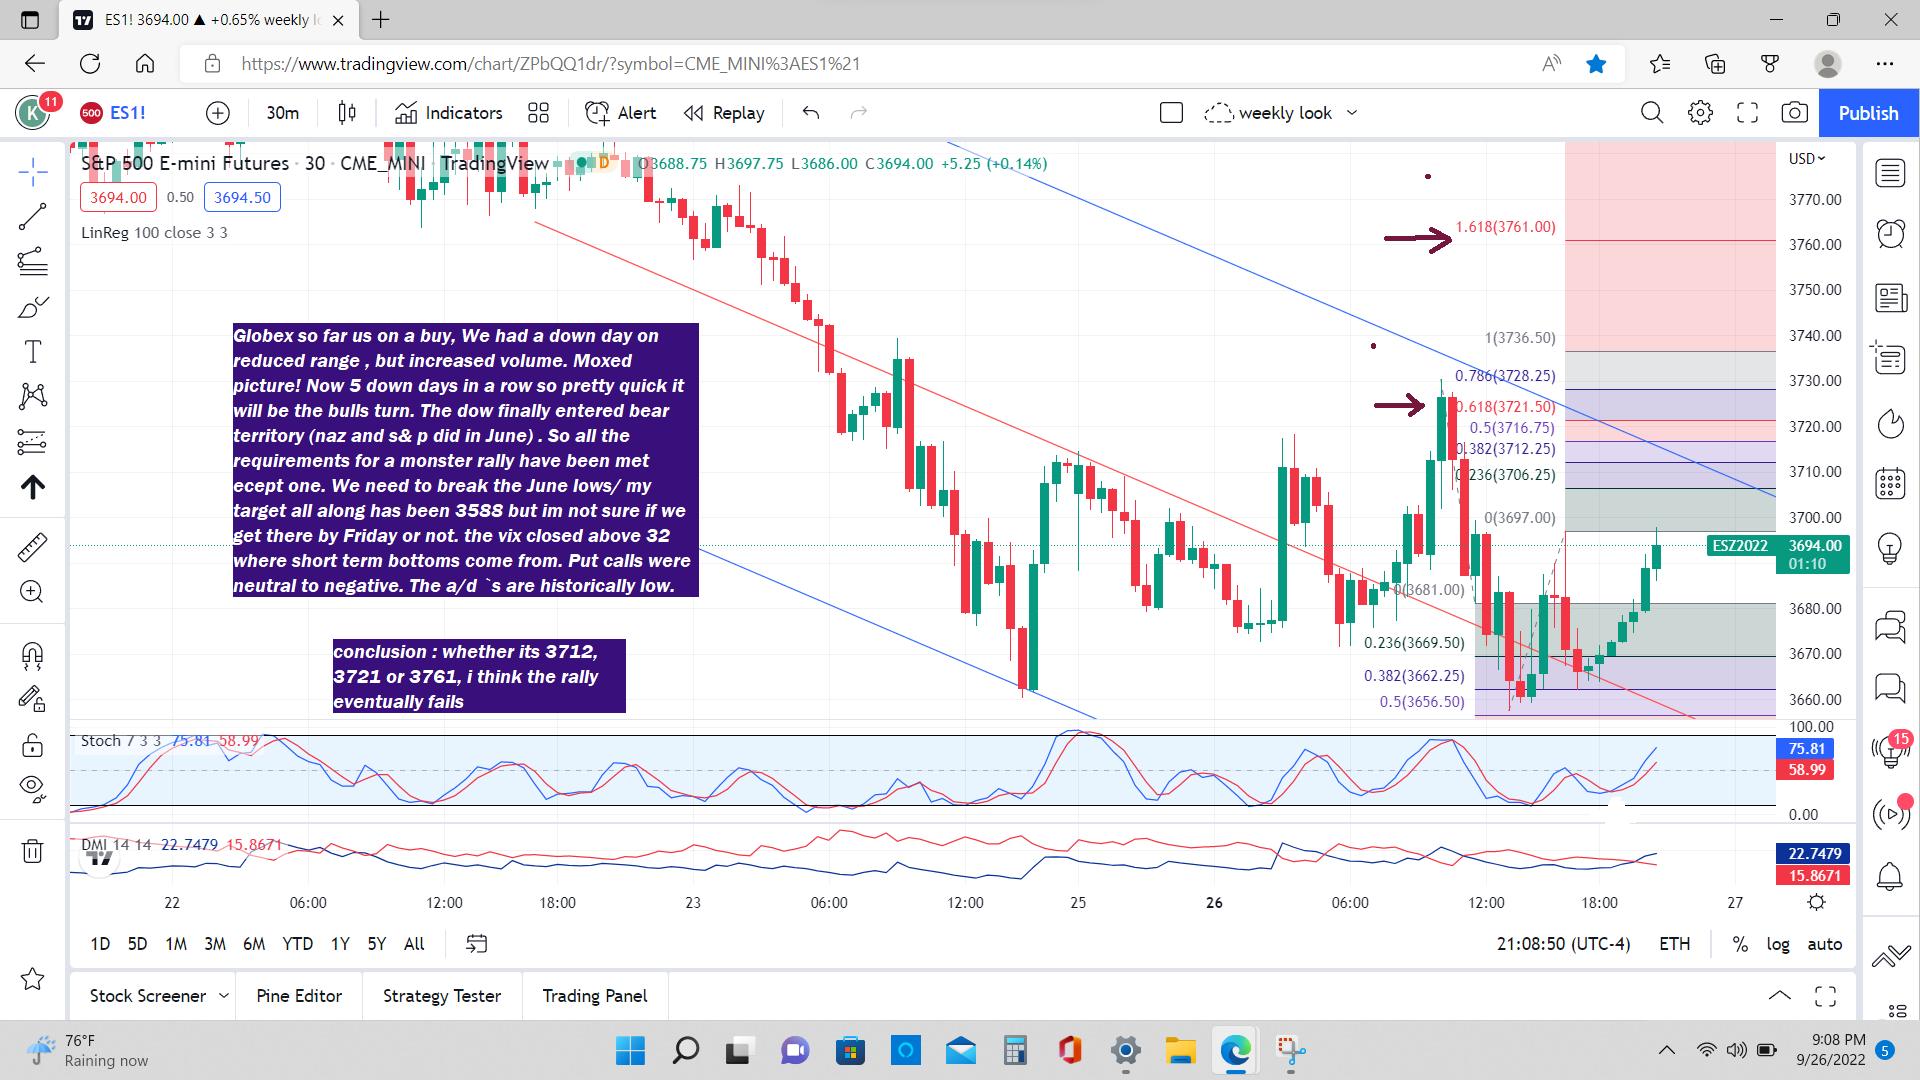
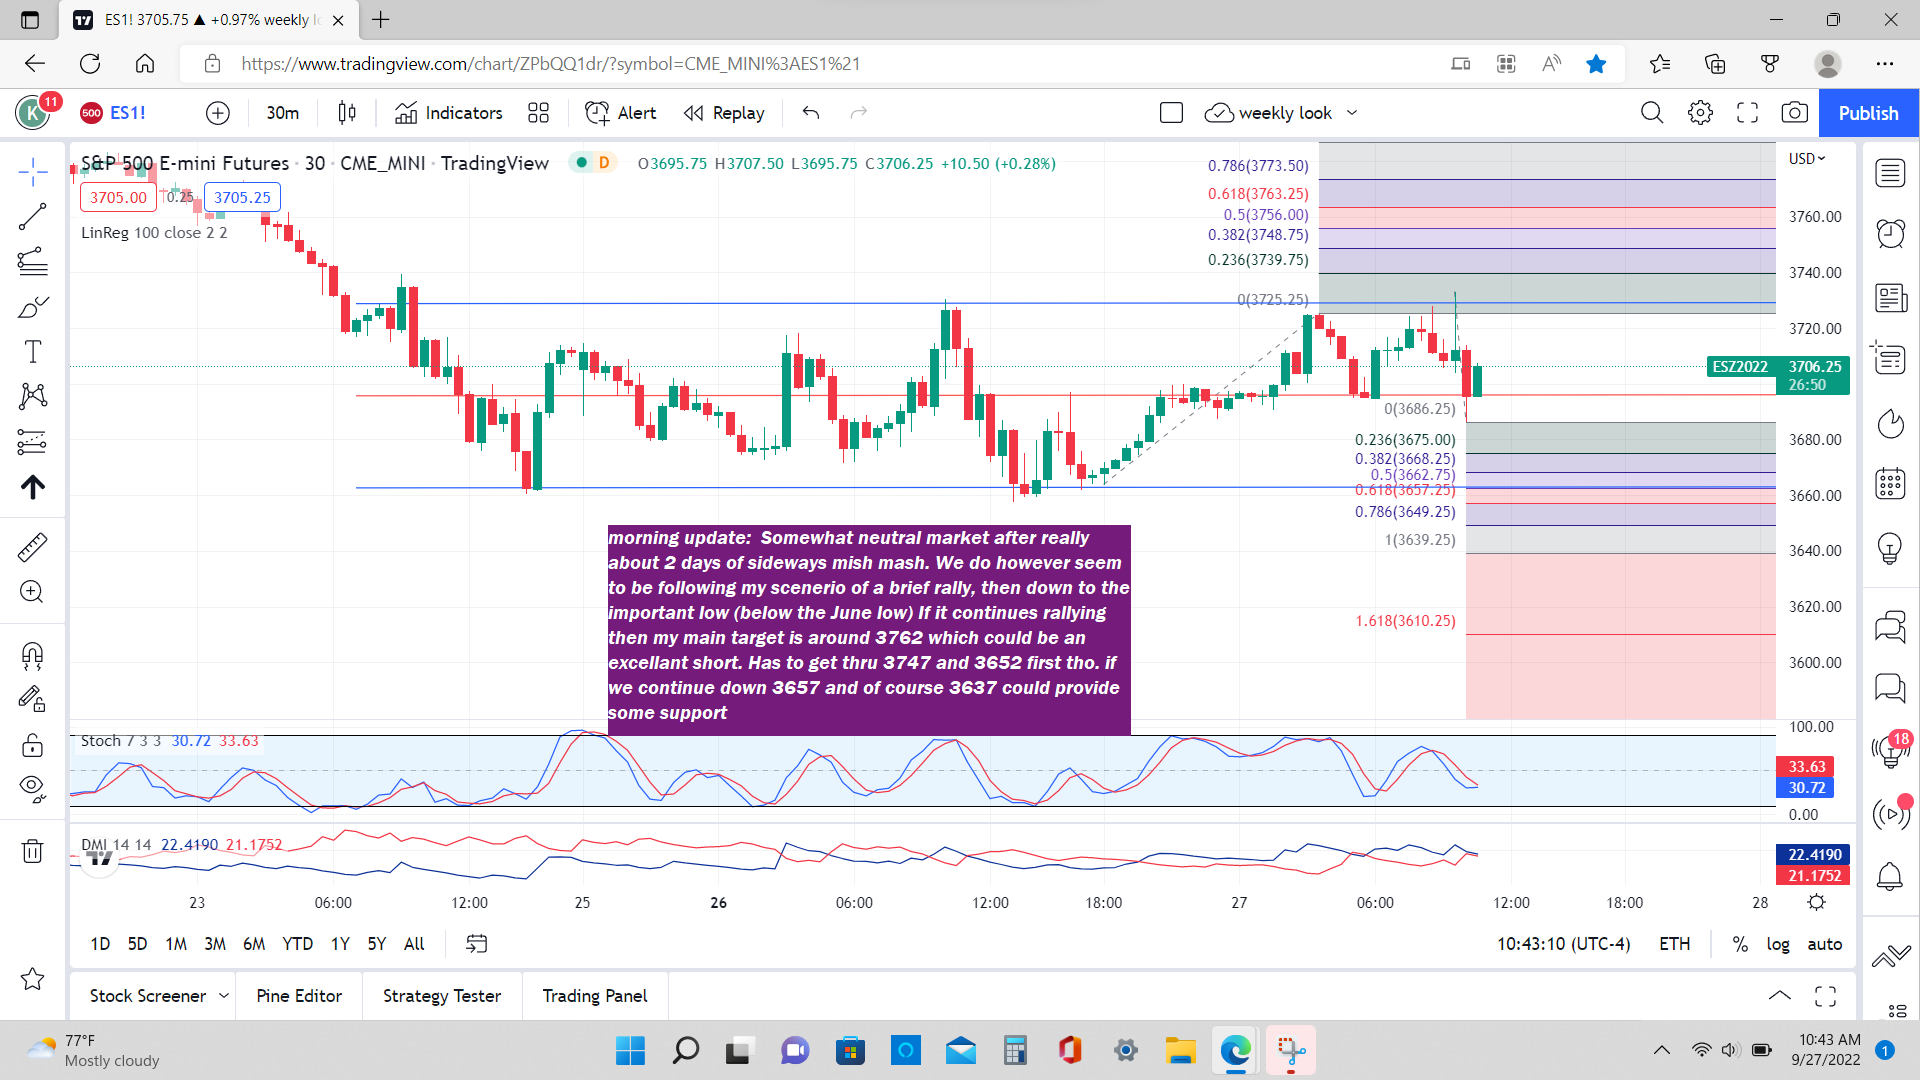
ES 9-27-22
Bespoke
@bespokeinvest
·
3h
Today we saw the S&P 500's 10-day advance/decline line -- one of the main indicators used to measure short-term breadth -- hit a record low (-2,682) since 1990. The most oversold it has been in the last 32 years of US markets. And from Marketwatch: According to Dow Jones Market Data going back to 1950, the average and median returns for the Dow were negative in the week after entering a bear market, while average and median returns for periods up to one year later were positive.
sorry for the late post... trying to get ready for Ian! Lol
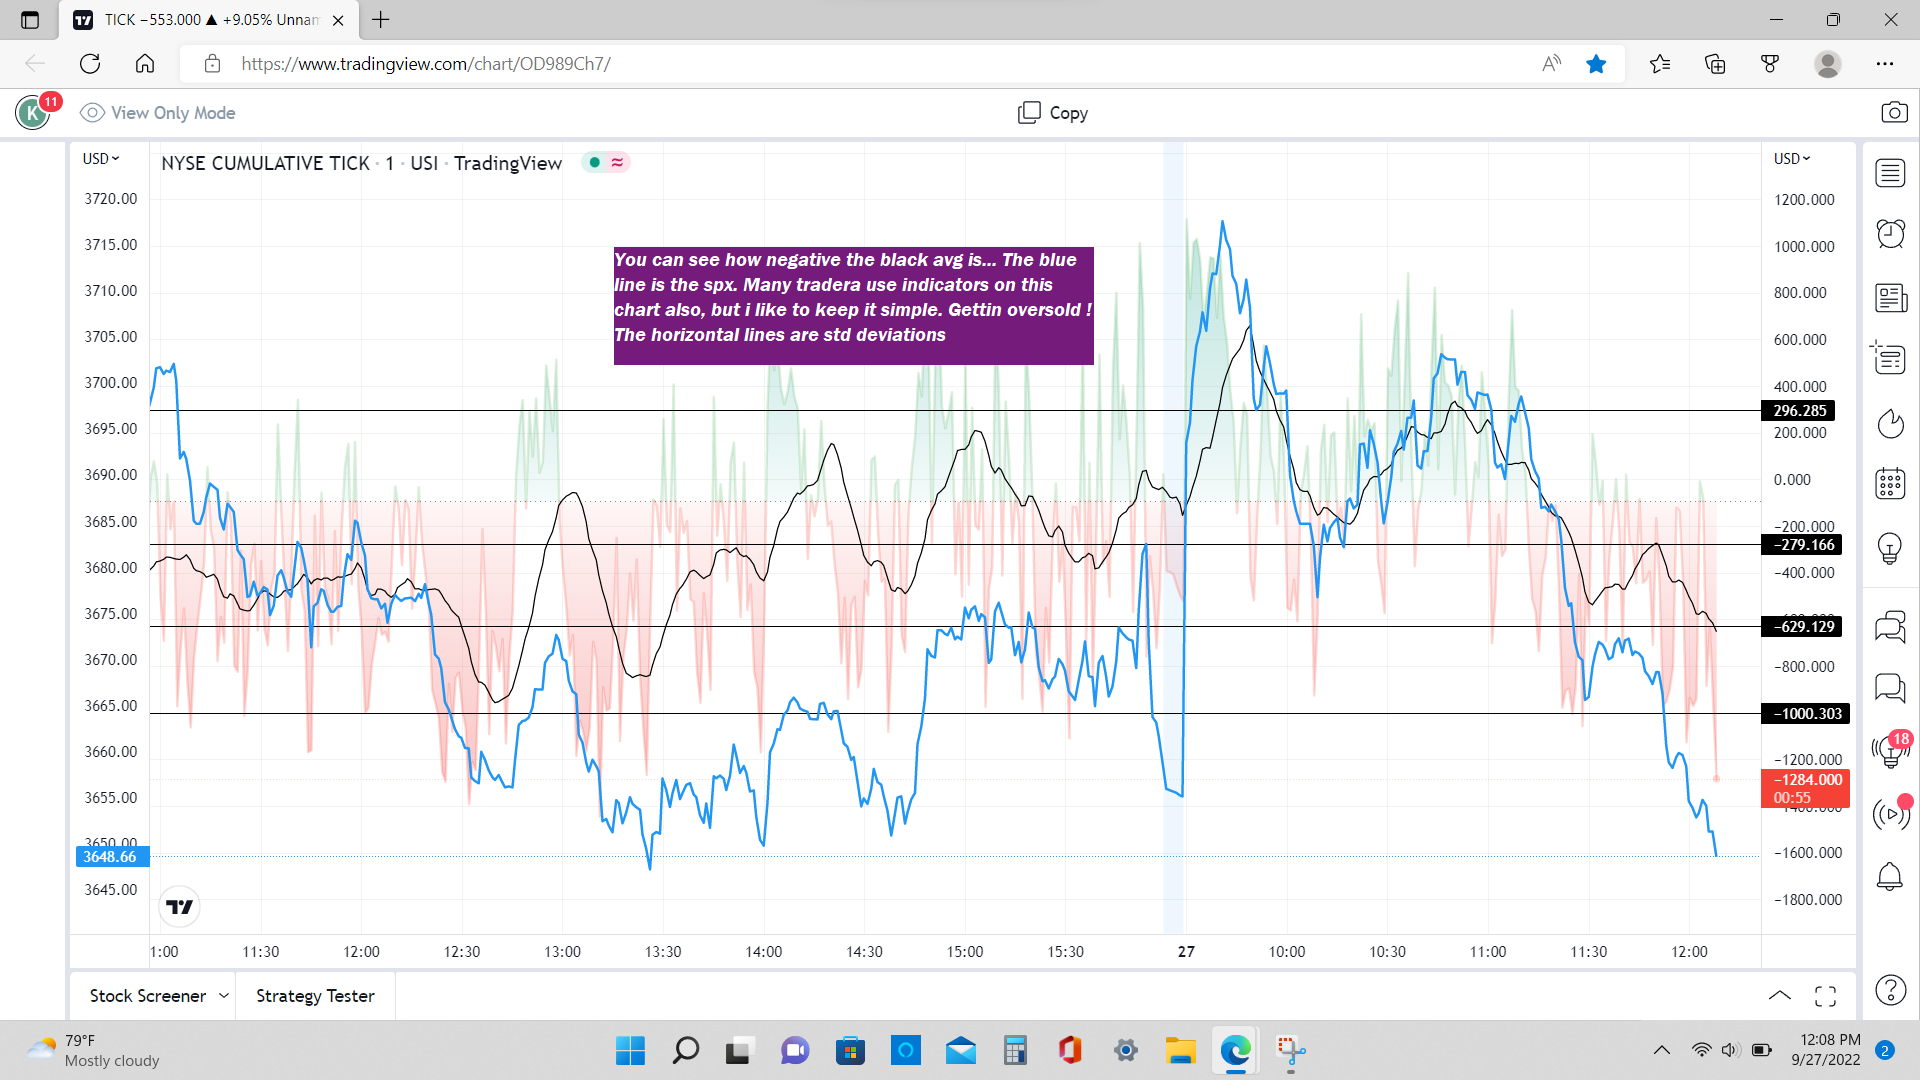
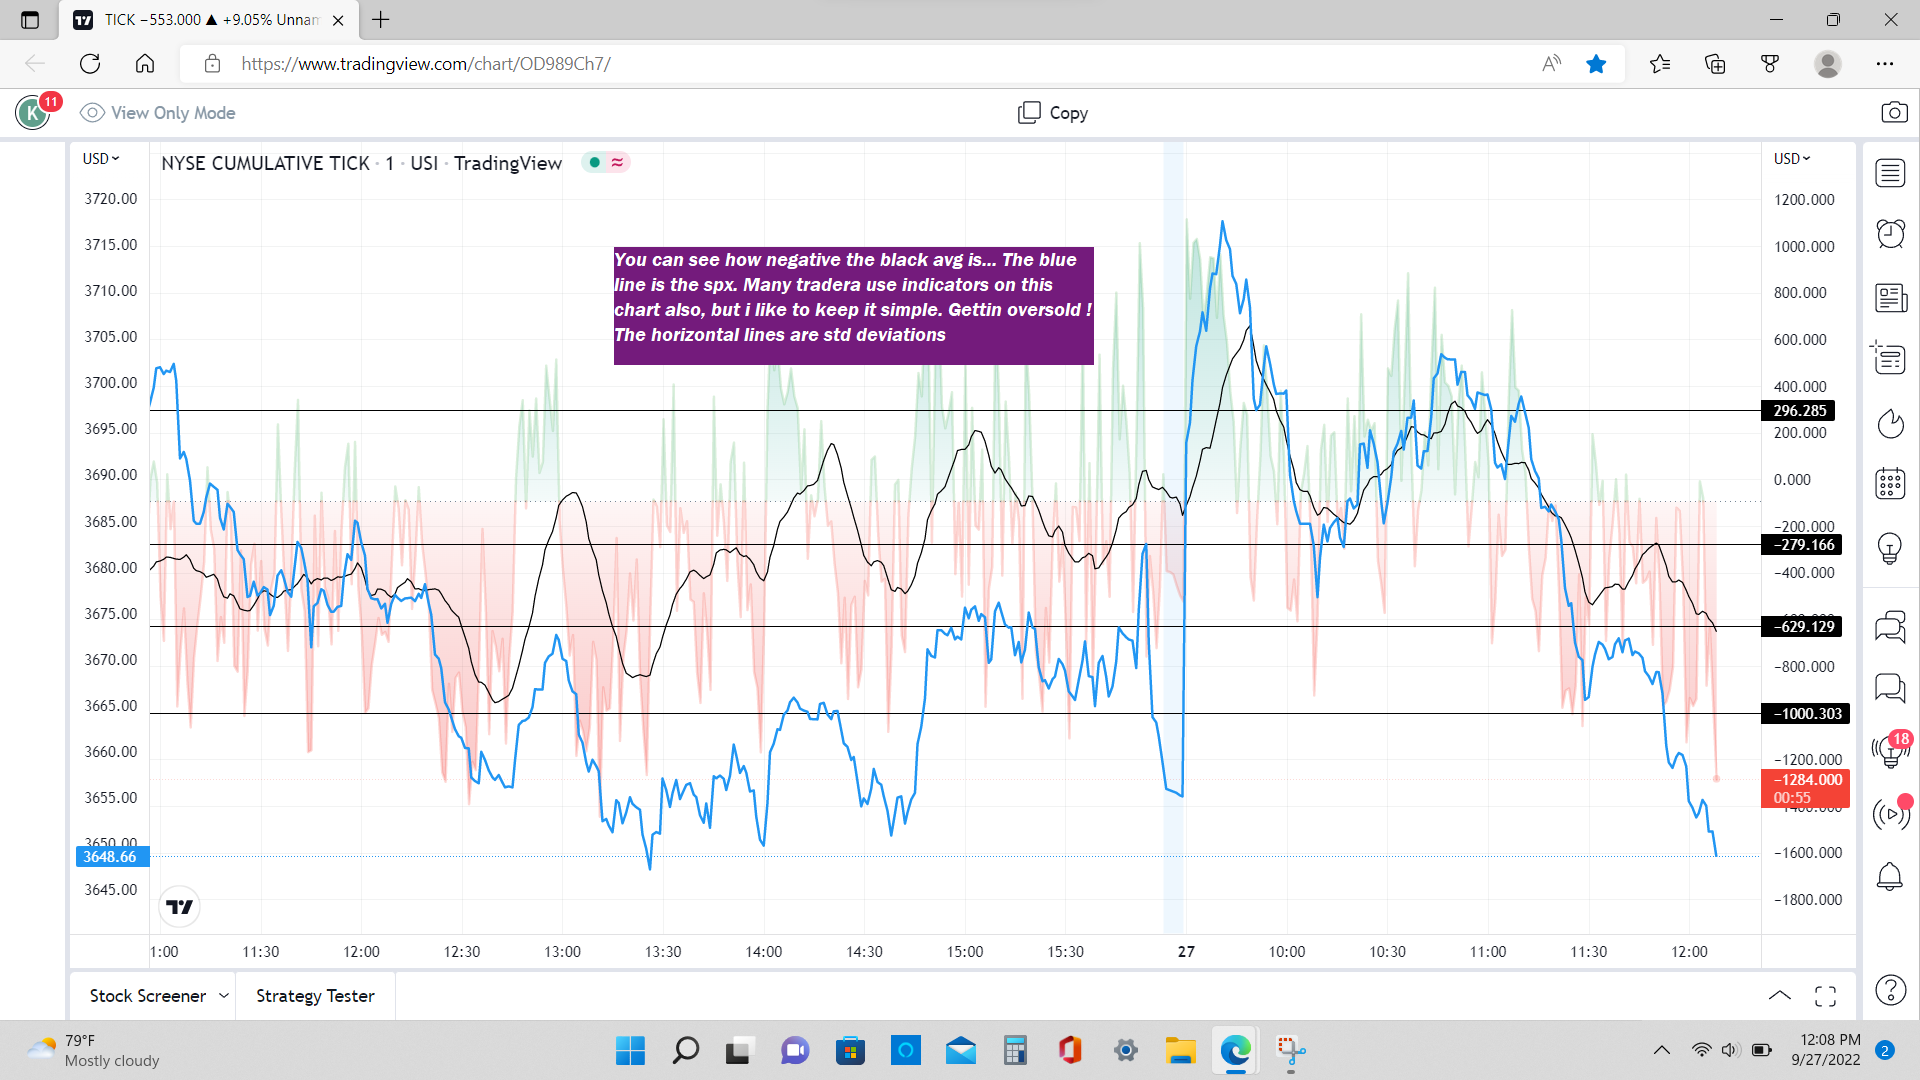
Ticks are positive so far, but its early and that could change later this morning or this afternoon!
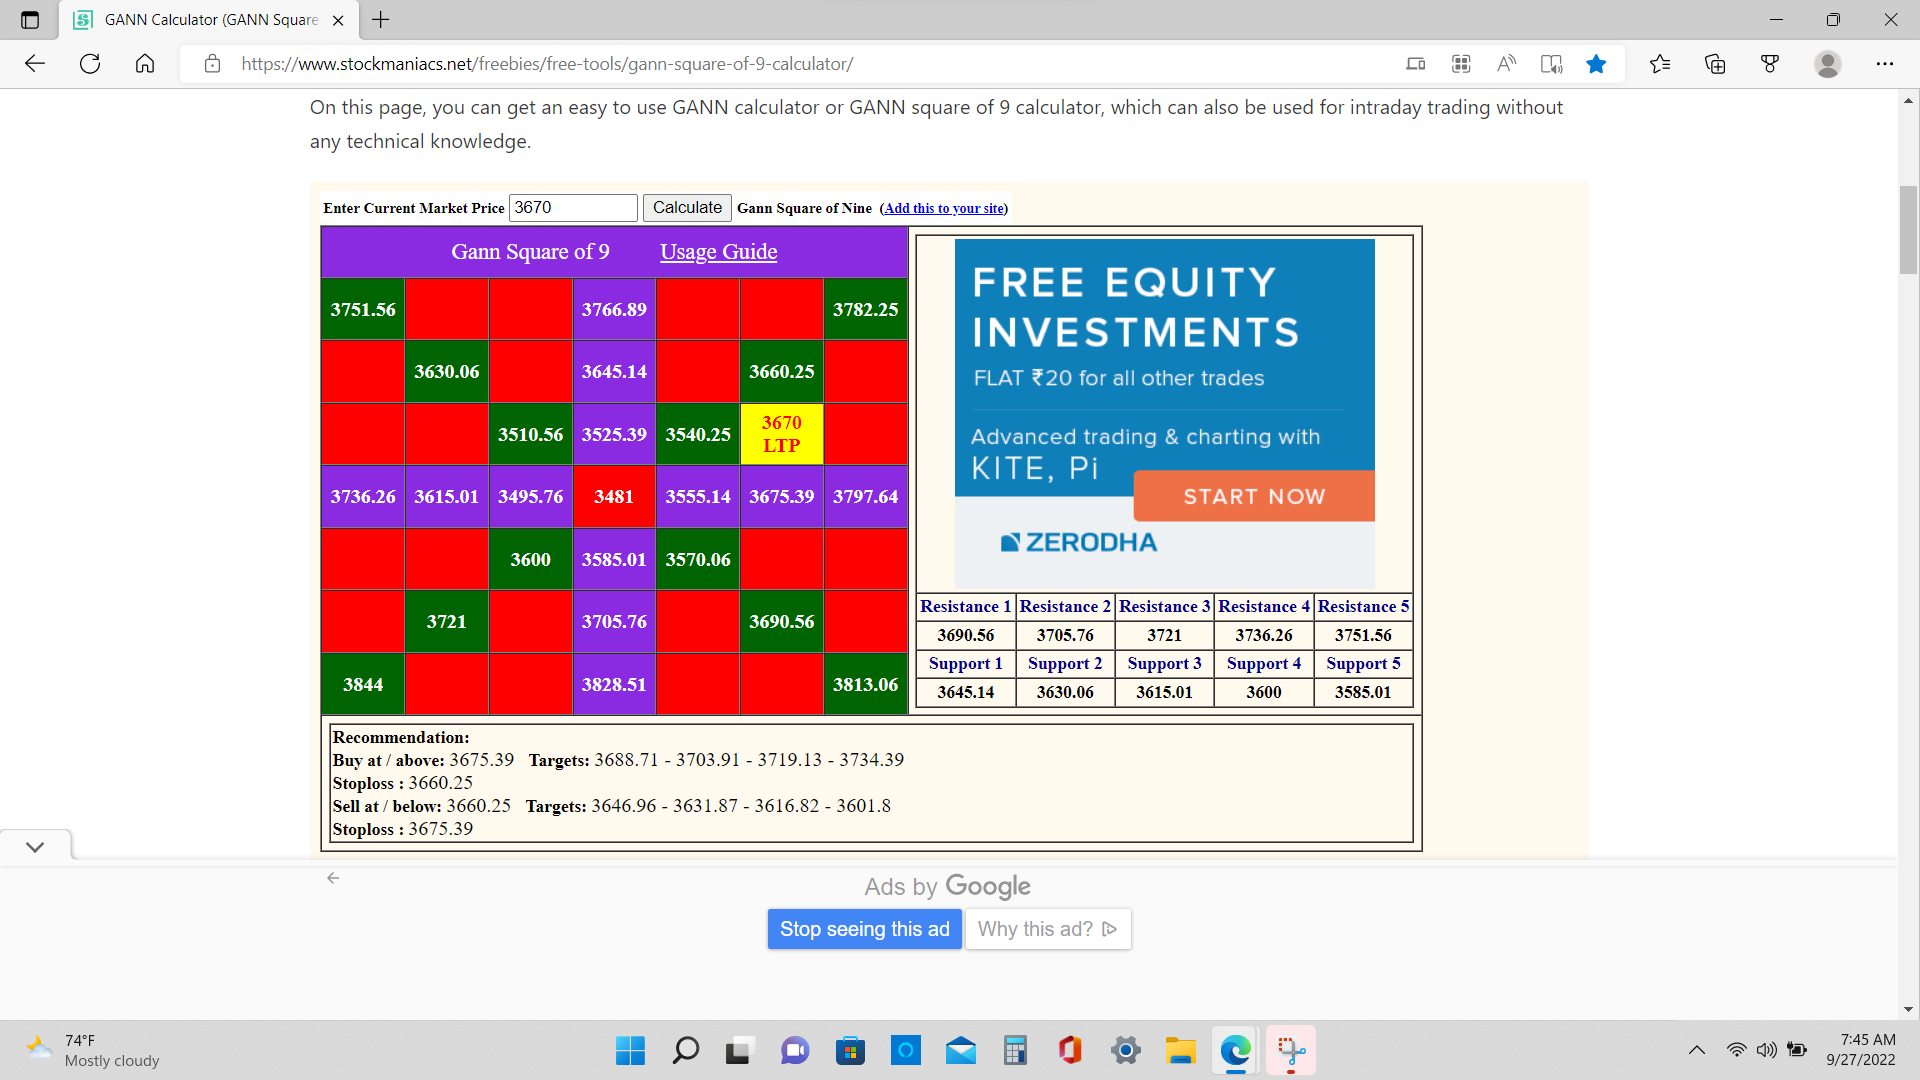
Oh so you use Gann squares? Does it help alongside fibs? In confluence maybe?
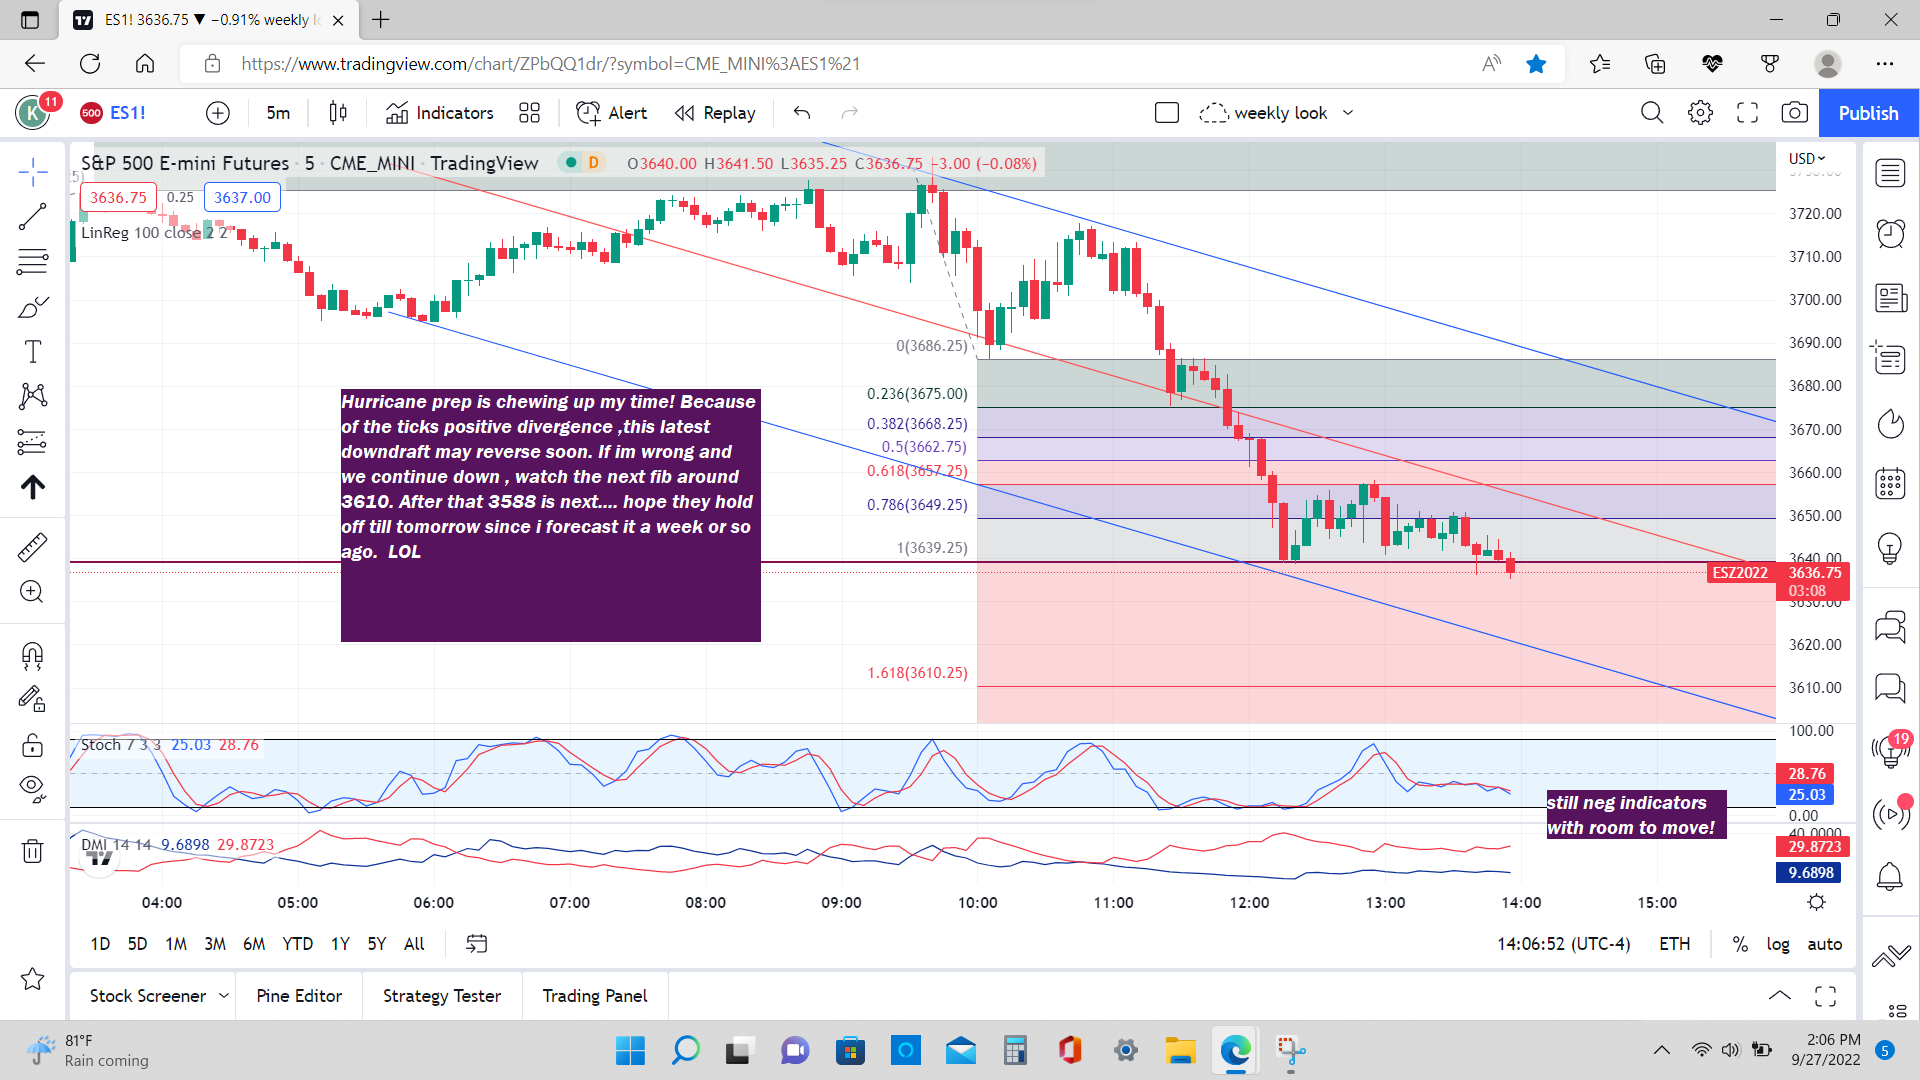
Exactly right , i look for confluence but i give priority to the fibs. The trick is to know which fibs will be a good reaction and for that i mainly rely on my indicators. I also look for confluence in my fibs ,which on short term charts i draw daily from many different highs and lows. When several different ones say the same number, I figure they`re trying to tell me something (like 3588) . Nothing works 100% of course, but combined with cycles and seasonals they give me some good clues
Wow, ticks went below zero about 10 min ago and 20 points down is the result... they remain very negative for now!
And now the 30 min has just gone to sell (usualyy good for 30-50 points from where the signal happens
How do you figure out cycles? Based on gann too? And seasonality avg data?
Originally posted by Ace21baseThe cycles are my own design ... visit Kools Tools here at Mypivots to learn how(its free, but i think u have to register. the seasonality comes from stock traders almanac, Cobras marketview and a couple other sources.. i study the internet every day.. wow, this day is beginning to look exciting!
How do you figure out cycles? Based on gann too? And seasonality avg data?
Emini Day Trading /
Daily Notes /
Forecast /
Economic Events /
Search /
Terms and Conditions /
Disclaimer /
Books /
Online Books /
Site Map /
Contact /
Privacy Policy /
Links /
About /
Day Trading Forum /
Investment Calculators /
Pivot Point Calculator /
Market Profile Generator /
Fibonacci Calculator /
Mailing List /
Advertise Here /
Articles /
Financial Terms /
Brokers /
Software /
Holidays /
Stock Split Calendar /
Mortgage Calculator /
Donate
Copyright © 2004-2023, MyPivots. All rights reserved.
Copyright © 2004-2023, MyPivots. All rights reserved.
