Long-term and Short-term Setups
Hello Traders,
I’m a pro with 7+ years of experience in the market. I want to help out retail traders. So, here I post some of my long-term and short-term setups and crisp points of the reasoning and my conclusion. Hope it benefits you.
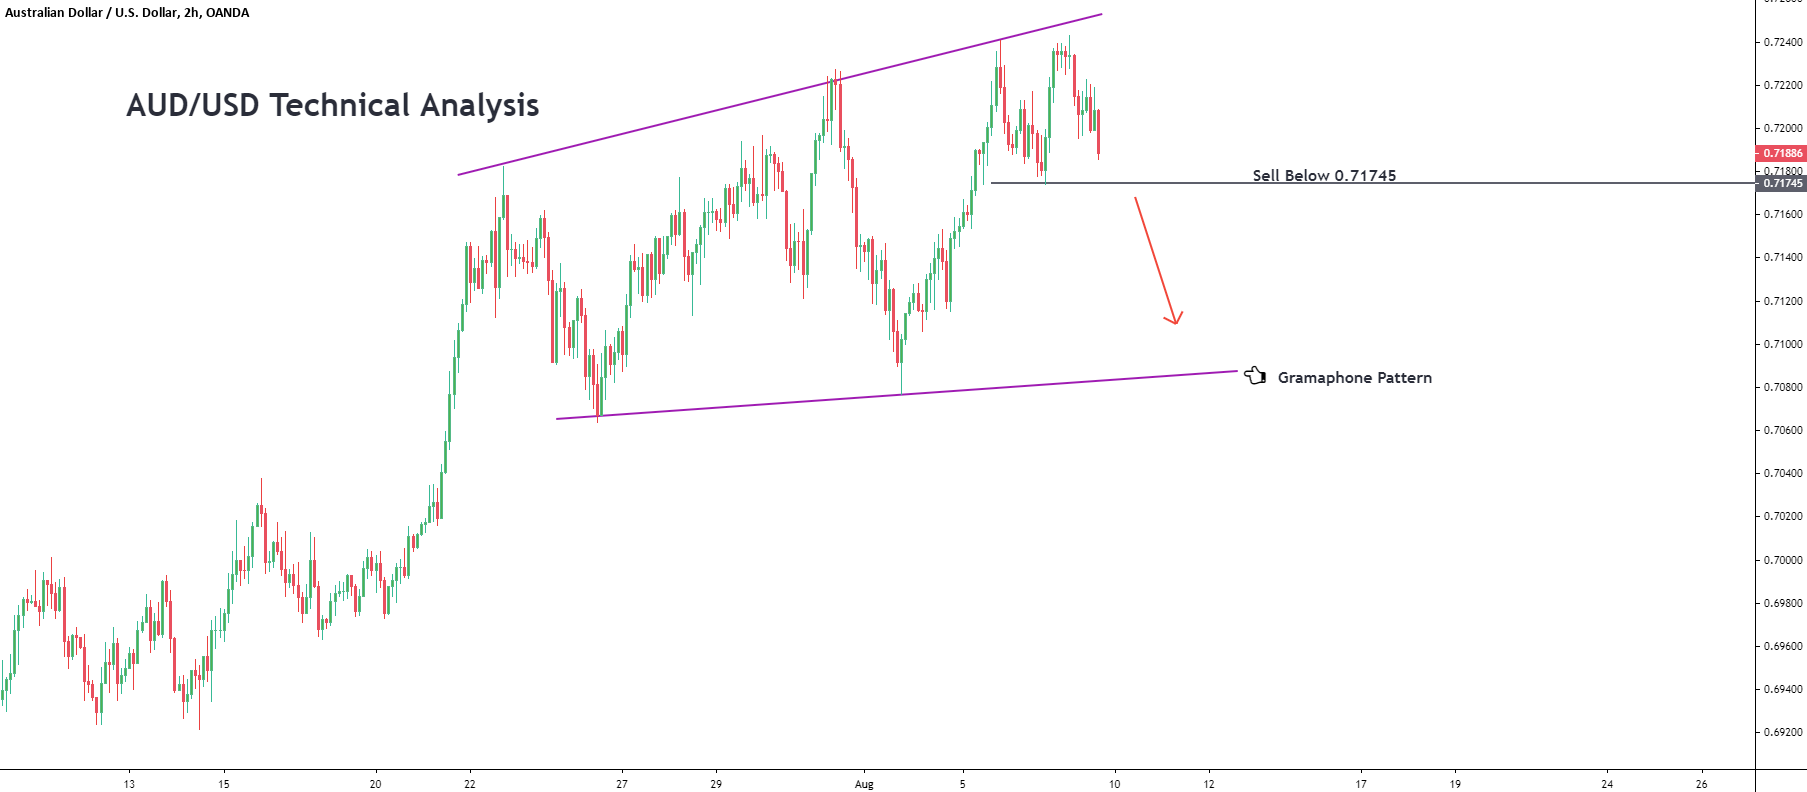
AUD/USD Technical Analysis
~~ The counter has formed a gramophone pattern.
~~ It has hit the upper trendline and is coming down with strong momentum.
~~ We advise traders to go short when the pair breaks the support level of 0.71745 and expect a sell-off to lower trendline.
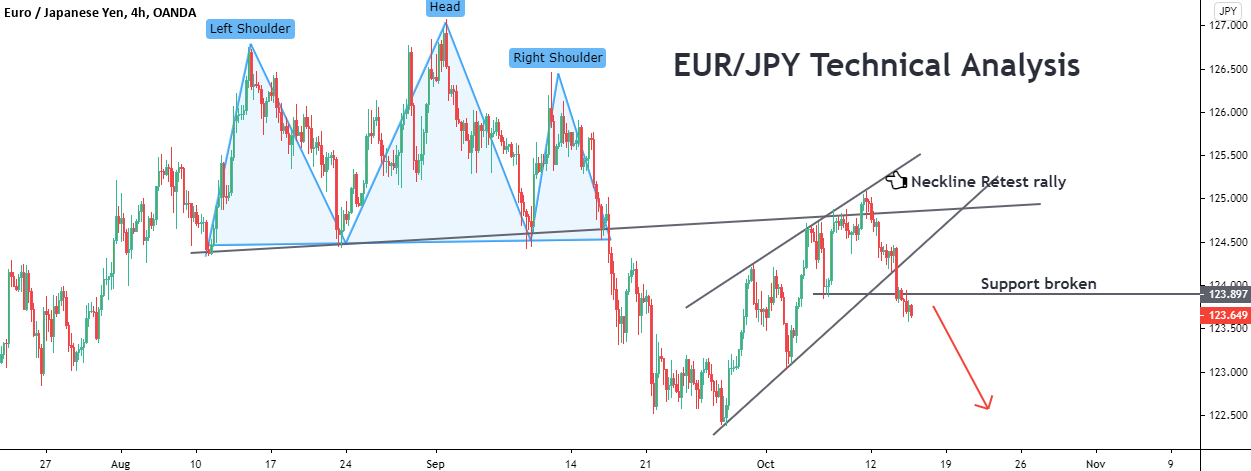
EUR/JPY Technical Analysis
~~ The counter has made a retest of the broken head and shoulder neckline.
~~ It has made the retracement in the form of a bearish flag and has broken down from it.
~~ Further, it has crossed critical support of 123.9 and hence we expect the pair to be bearish in the short-term.
~~ The counter has made a retest of the broken head and shoulder neckline.
~~ It has made the retracement in the form of a bearish flag and has broken down from it.
~~ Further, it has crossed critical support of 123.9 and hence we expect the pair to be bearish in the short-term.
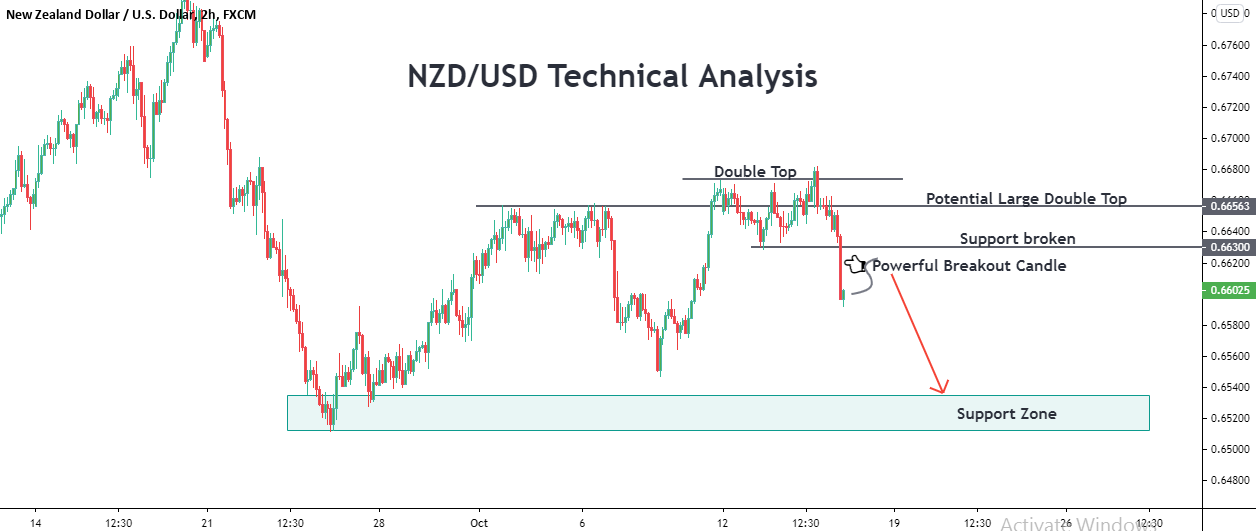
NZD/USD Technical Analysis
~~ The counter has formed a double top pattern in the short-term.
~~ Further, it has broken down with a strong bearish candle.
~~ The formation interpreted a solid distribution around 0.667 levels.
~~ Hence, we expect the pair to slide down from here.
~~ The counter has formed a double top pattern in the short-term.
~~ Further, it has broken down with a strong bearish candle.
~~ The formation interpreted a solid distribution around 0.667 levels.
~~ Hence, we expect the pair to slide down from here.
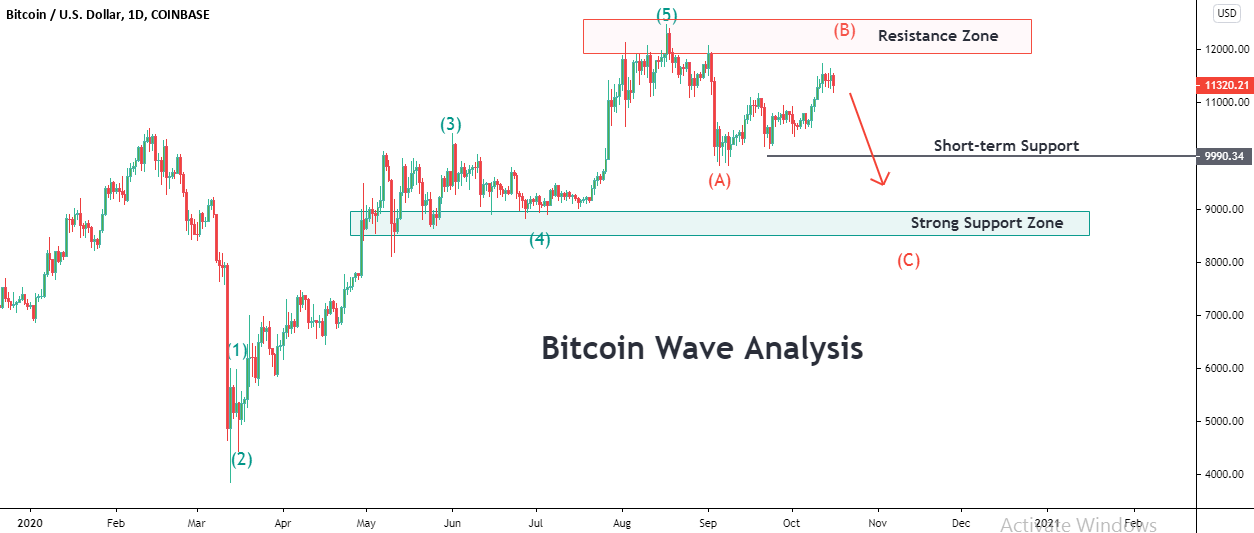
BTC/USD Wave Analysis
~~ Bitcoin has been in a bullish correction for the last few days.
~~ The limping move to the upside could be interpreted as wave B.
~~ Now, we expect a wave C move to the downside.
~~ Bitcoin has been in a bullish correction for the last few days.
~~ The limping move to the upside could be interpreted as wave B.
~~ Now, we expect a wave C move to the downside.
EUR/USD Wave Analysis
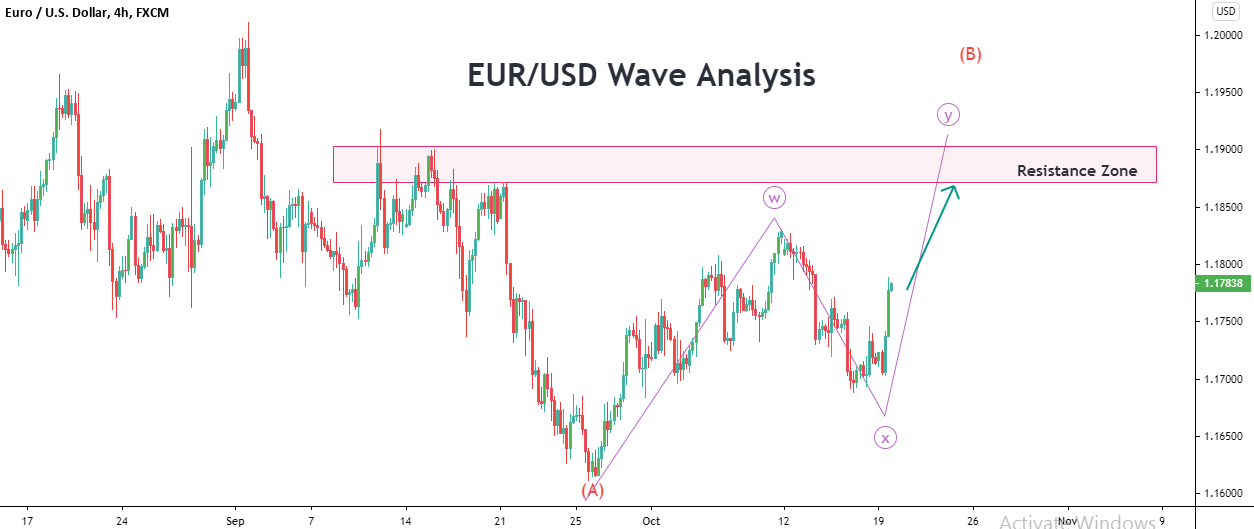
~~ The counter is currently forming an ABC correction.
~~ It is now in its second leg which is of the wxy wave form.
~~ Now, the pair is making a bullish move to complete the wave y and hence we expect the pair to be bullish in the near-term.
~~ The counter is currently forming an ABC correction.
~~ It is now in its second leg which is of the wxy wave form.
~~ Now, the pair is making a bullish move to complete the wave y and hence we expect the pair to be bullish in the near-term.
USD/CHF Wave Analysis
~~ The counter is currently in an ABC correction.
~~ It is now in its final stage for wave B looking out for support.
~~ We expect the pair to find its support around the current price point and head higher.
~~ The counter is currently in an ABC correction.
~~ It is now in its final stage for wave B looking out for support.
~~ We expect the pair to find its support around the current price point and head higher.
AUD/USD Wave Analysis
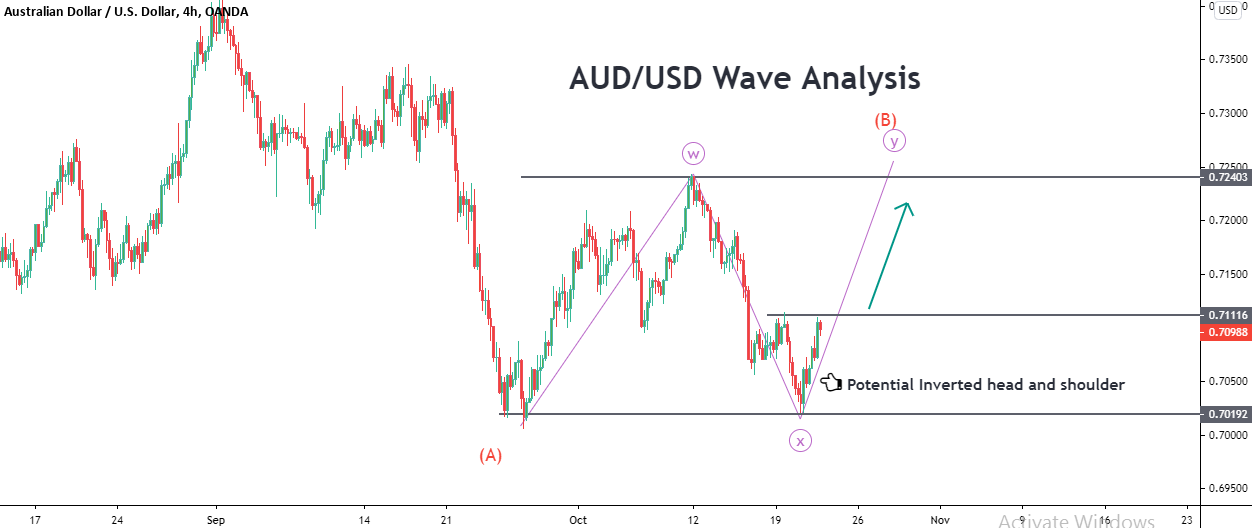
~~ The counter is currently forming an ABC correction.
~~ It has completed the w and x waves of the wave B and is now moving up to form a wave y.
~~ Hence, we expect the pair to be bullish in the near-term.
~~ The counter is currently forming an ABC correction.
~~ It has completed the w and x waves of the wave B and is now moving up to form a wave y.
~~ Hence, we expect the pair to be bullish in the near-term.
EUR/USD Technical Analysis
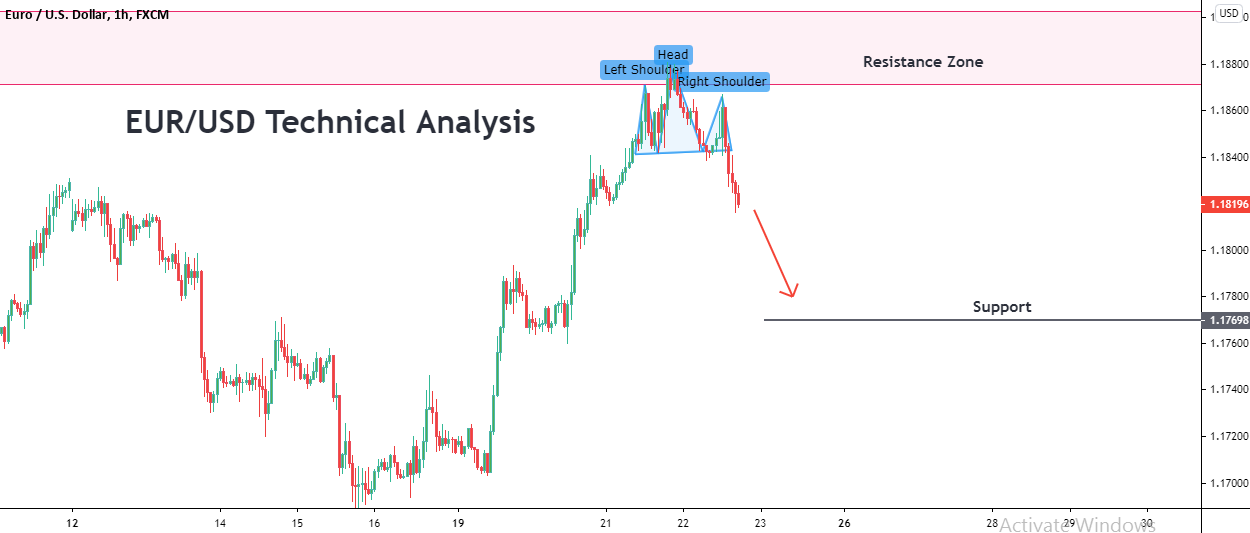
~~ As we mentioned in our previous post, 1.18700 is a strong resistance for EUR/USD.
~~ Now, it has formed a head and shoulder pattern at the zone and is coming down strongly.
~~ The next support is only at 1.17500 and we expect a free ride to bears till then.
~~ As we mentioned in our previous post, 1.18700 is a strong resistance for EUR/USD.
~~ Now, it has formed a head and shoulder pattern at the zone and is coming down strongly.
~~ The next support is only at 1.17500 and we expect a free ride to bears till then.
AUD/CHF Wave Analysis
~~ After completing a bearish cycle, the counter is limping up to complete ABC correction.
~~ It is forming a wave A in the form of a bearish flag.
~~ We expect it to render a bearish breakout to form wave B.
~~ After completing a bearish cycle, the counter is limping up to complete ABC correction.
~~ It is forming a wave A in the form of a bearish flag.
~~ We expect it to render a bearish breakout to form wave B.
USD/CAD Technical Analysis
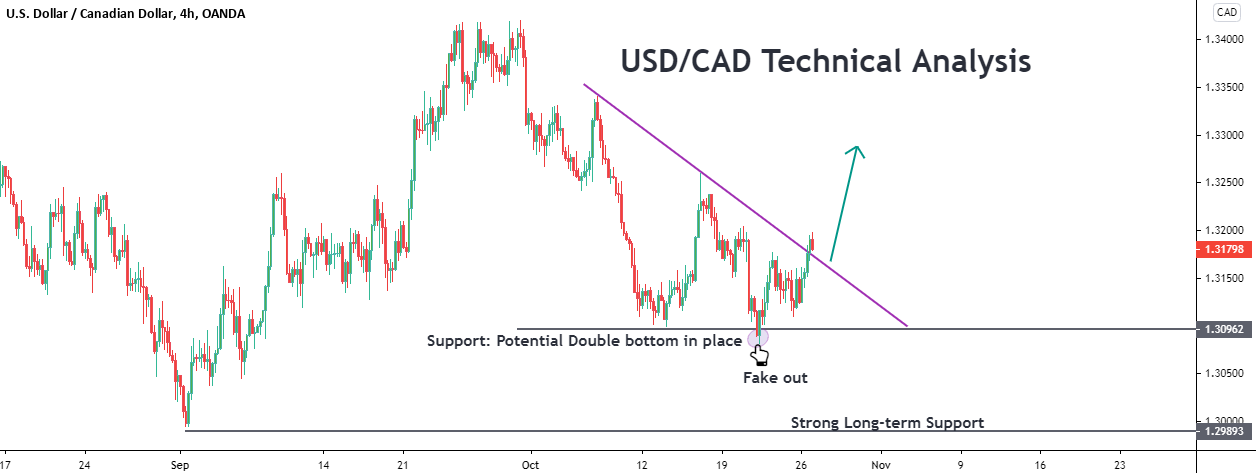
~~ The counter has bounced off strongly from the support 1.31, after trapping the bears with a fakeout.
~~ Now, it has taken down a bearish trendline as well.
~~Hence, we expect the pair to be bullish in the short-term.
~~ The counter has bounced off strongly from the support 1.31, after trapping the bears with a fakeout.
~~ Now, it has taken down a bearish trendline as well.
~~Hence, we expect the pair to be bullish in the short-term.
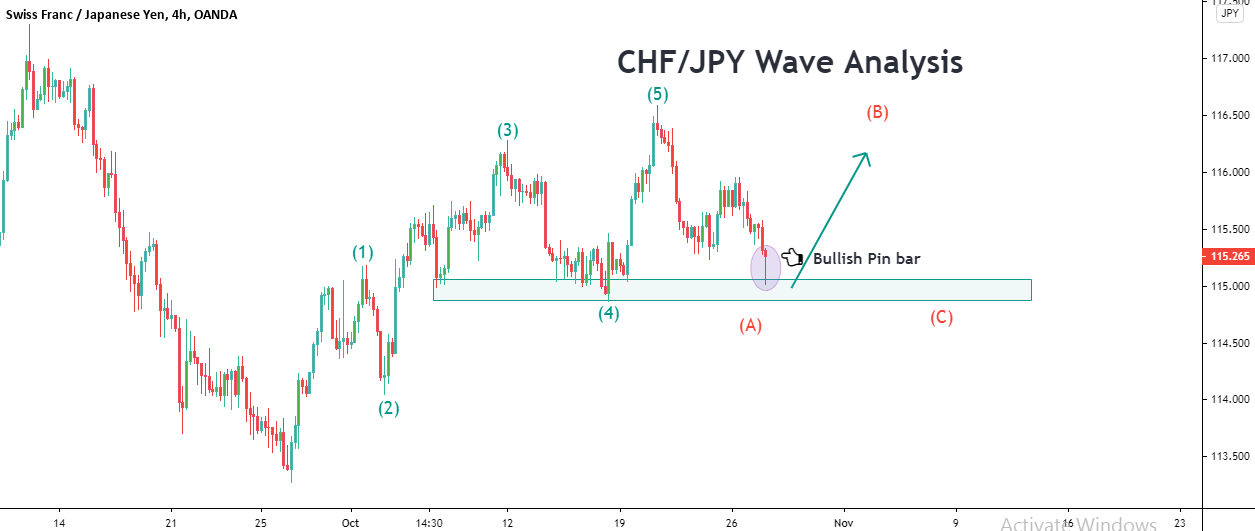
CHF/JPY Wave Analysis
~~ After completing a 5-wave bull cycle, the counter is currently in an ABC correction phase.
~~ It is now at a strong price action support zone and at the final stage of wave A.
~~ Hence, we expect the pair to be bullish in the near-term.
~~ After completing a 5-wave bull cycle, the counter is currently in an ABC correction phase.
~~ It is now at a strong price action support zone and at the final stage of wave A.
~~ Hence, we expect the pair to be bullish in the near-term.
When it comes to long-term and short-term setups in forex trading, each has its own strategy and approach depending on your goals and risk tolerance. Understanding the differences and how to execute these setups effectively can make a significant difference in your trading success. Traders offer some insightful perspectives that might help you choose the right approach for your trading style.
Emini Day Trading /
Daily Notes /
Forecast /
Economic Events /
Search /
Terms and Conditions /
Disclaimer /
Books /
Online Books /
Site Map /
Contact /
Privacy Policy /
Links /
About /
Day Trading Forum /
Investment Calculators /
Pivot Point Calculator /
Market Profile Generator /
Fibonacci Calculator /
Mailing List /
Advertise Here /
Articles /
Financial Terms /
Brokers /
Software /
Holidays /
Stock Split Calendar /
Mortgage Calculator /
Donate
Copyright © 2004-2023, MyPivots. All rights reserved.
Copyright © 2004-2023, MyPivots. All rights reserved.
