ES 09-28-16
Daily R1 at 60 and PP at 46.5. Coincidentally, those are also the locations of the 0.5 SD volatility bands (60 and 44.5), or the numbers that Bruce says are virtually guaranteed to hit during the day. Also both those numbers are just outside the current ONH and ONL too. I have started waiting until RTH open to being trading. I will post a bit once the market opens.
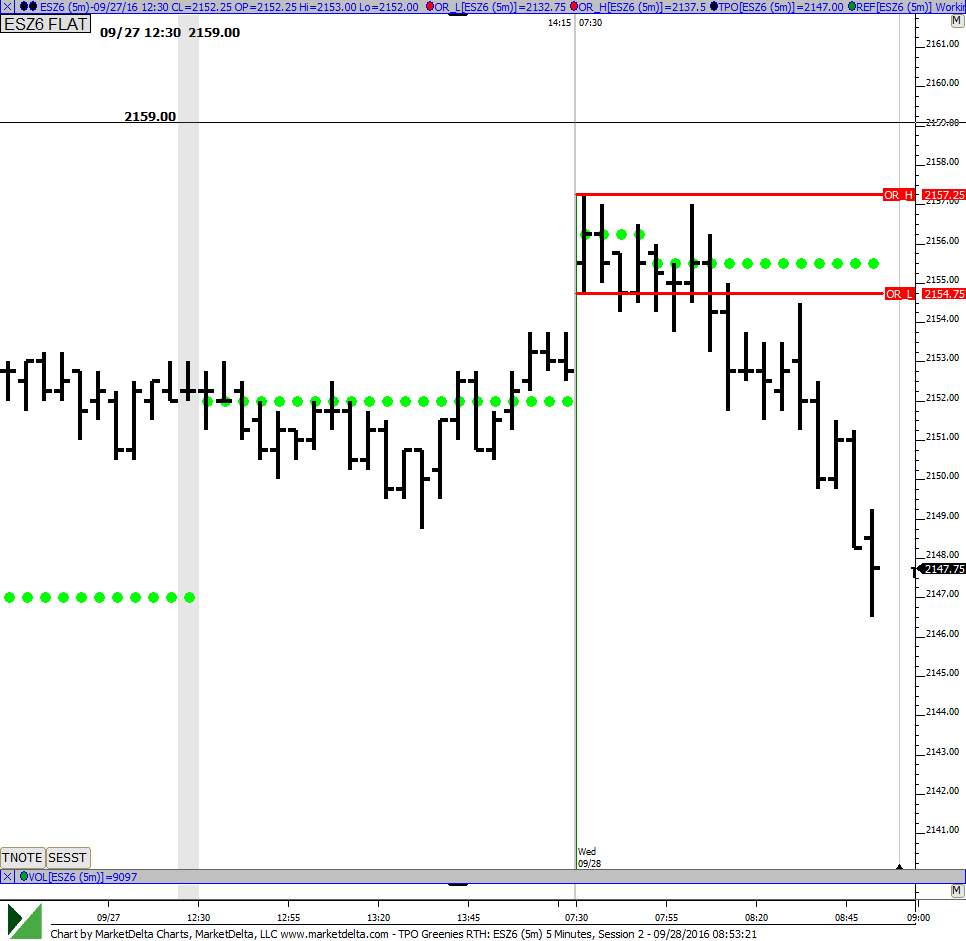
my ideal entry would have been closer to 58.5, the VPOC from 9/23 but the fact that the market had such a hard time trying to get there indicated to me that it might not get there and to jump on the short train. so i initiated a short inside the OR based on evidence and waited to exit at YD's VPOC. for continuation, prices would need to spend time below 54.75. that could also become a re-entry point for shorts looks for the below greenie at 47
today there were several FOMC members speaking in addition to the ECB president. I dont like that a lot because there are too many people hanging onto every word said and then start to swing the market without rhyme or reason. Reports are more manageable because you know that once a number is out, the reaction is instant. with people speaking, one has no idea when they might say something that could move the markets.
continuing to spend time below ORL bodes well for the shorts. I am not in at the moment but just an observation.
Here is an updated picture showing the pull back to 54.5 before continuing the leg down to the 47 level. I was NOT in this trade even though I saw it coming. need to build up the confidence to take such trades.
final comment. we got the PP at 46.5 and the 0.5SD number of 44.5
can someone tell me how to post a chart or where i can learn..i can save them in my trading platform but not to my computer..
good work newkid..what i been doing is watch lot size..when i see 298 or bigger i enter trade.after you post your chart there was 300 sold at 50.50 and 300 at 49.50 and 300 at 48.50....then there was big lot of 400 that buy 44.50..i been getting in and only taking one point..just something that i been doing..
please keep the post coming
example big lot of 300 buy 46.75
i got long at 46.25
out at 47.75
duck, what trading platform do you use? and do you have windows installed? if so, which version?
Emini Day Trading /
Daily Notes /
Forecast /
Economic Events /
Search /
Terms and Conditions /
Disclaimer /
Books /
Online Books /
Site Map /
Contact /
Privacy Policy /
Links /
About /
Day Trading Forum /
Investment Calculators /
Pivot Point Calculator /
Market Profile Generator /
Fibonacci Calculator /
Mailing List /
Advertise Here /
Articles /
Financial Terms /
Brokers /
Software /
Holidays /
Stock Split Calendar /
Mortgage Calculator /
Donate
Copyright © 2004-2023, MyPivots. All rights reserved.
Copyright © 2004-2023, MyPivots. All rights reserved.

