ES Monday 8-17-15
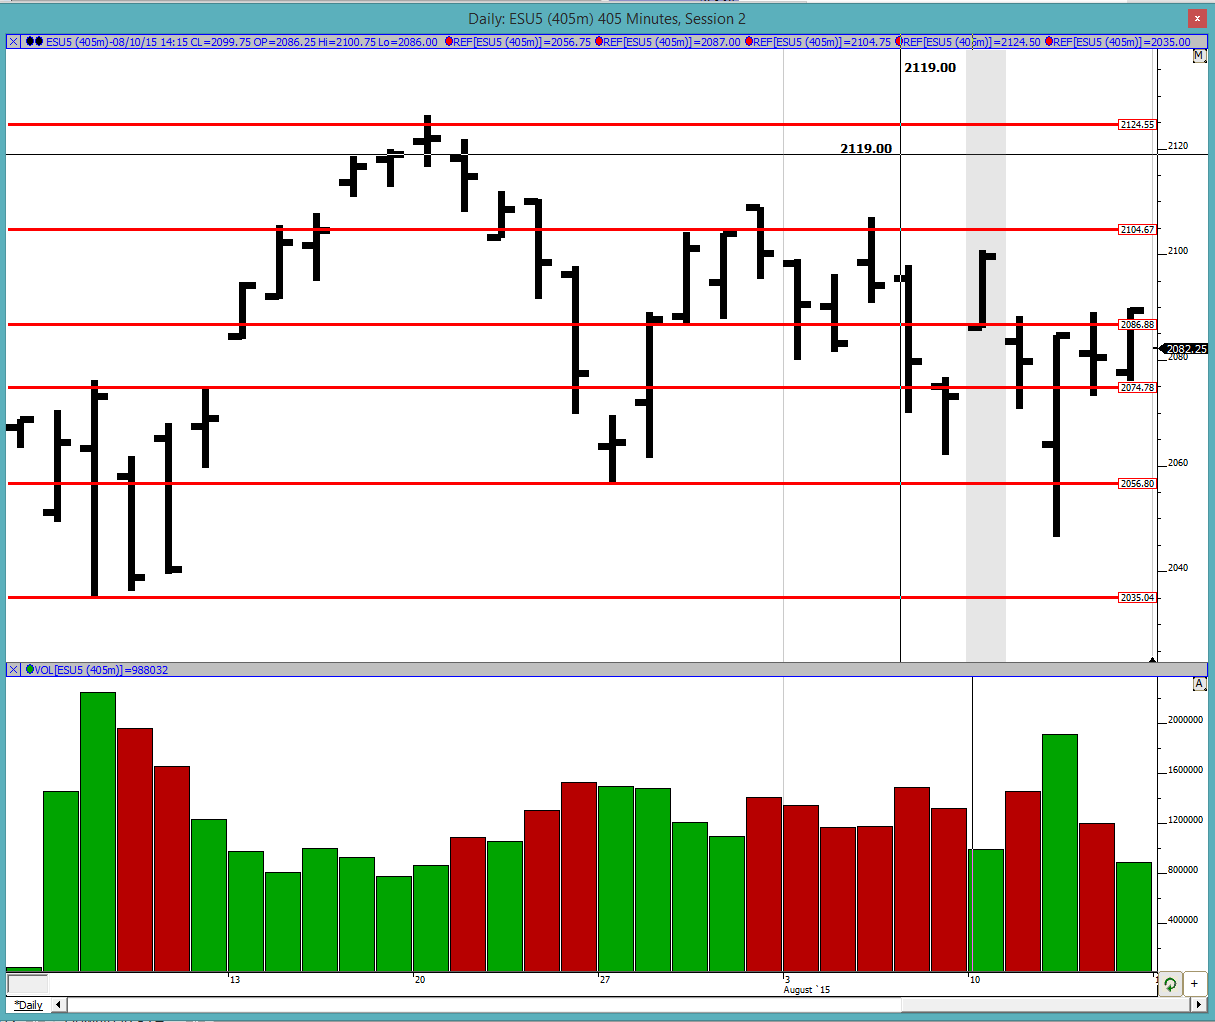
Good morning to all. We continue being in the bigger trading range and now also have a smaller 2 day balance. In these 2 days of balance we have had higher highs and higher lows but they are relatively close to each other so look for a break out of balance in either direction or even a fake out.
Greenies (past naked developing VPOCs): 2051.5, 2053.75, 2082.25, 2087.75, 2090.25, 2092.75, 2096.75, 2098, 2104.25, 2112.75, 2118.75 and 2123.5
Profile:
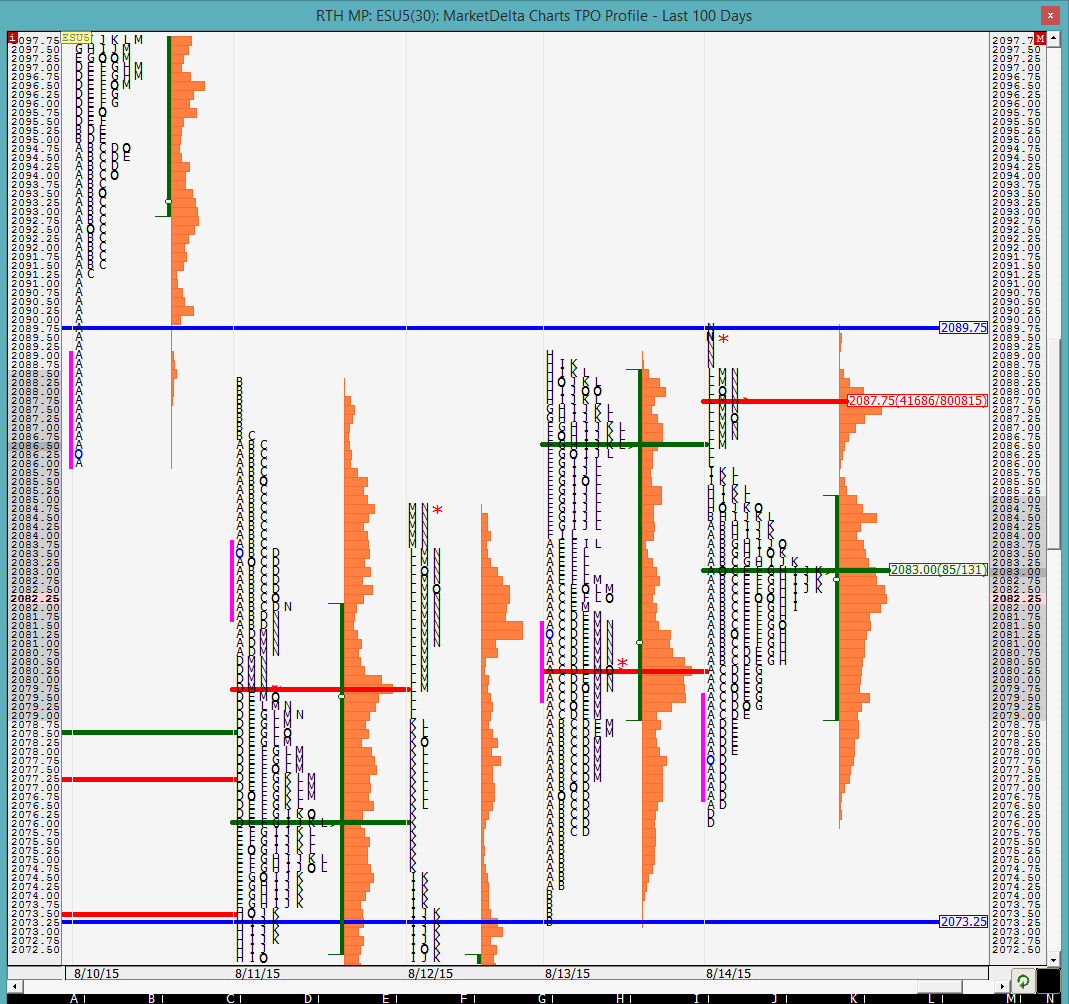
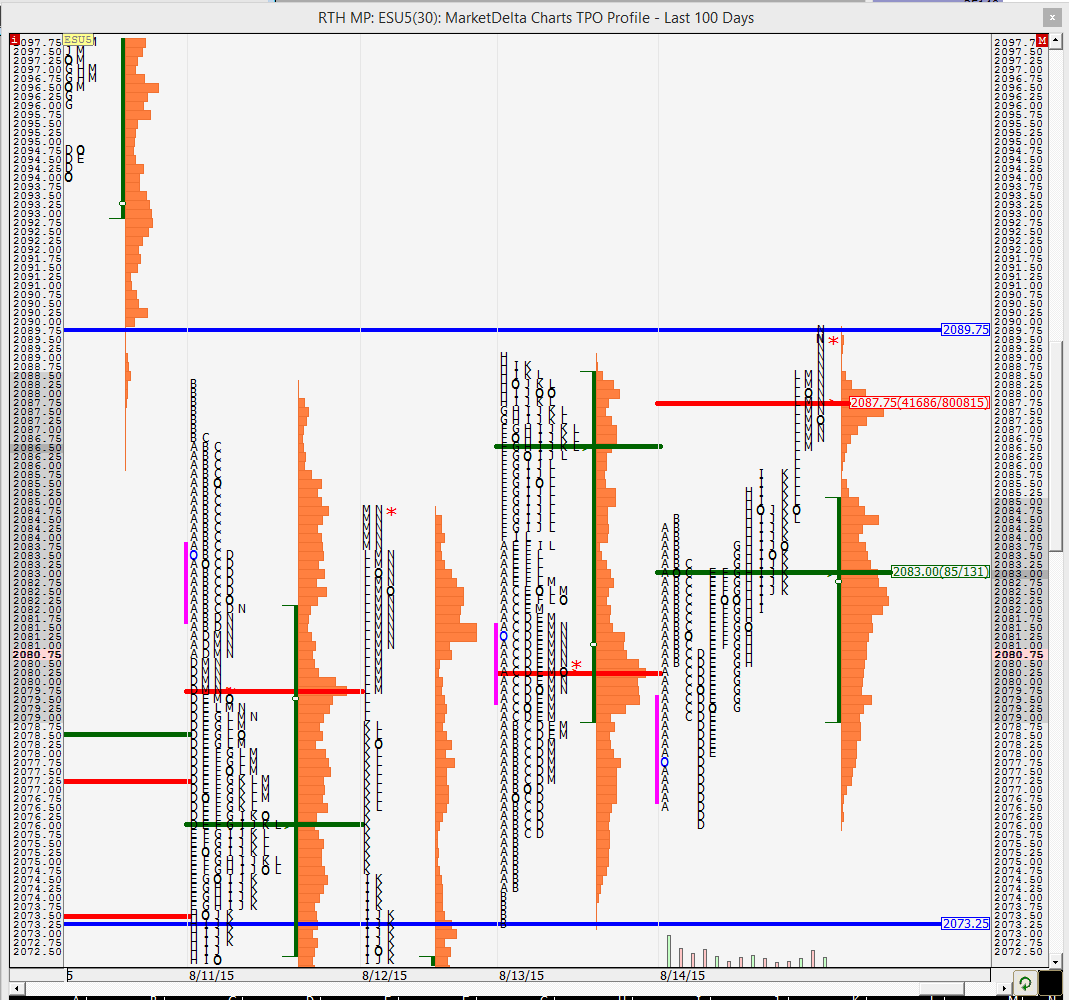
Friday was kind of a double distribution day with the separation by the 2 single prints in the L period with a prominent POC on the south of it and the VPOC on north of it. Conventional knowledge says that the prominent POC would be revisited at some point as well as the VPOC becomes a greenie. Technically we have enough excess on the lower side due to the 2 ticks in D period. On the upper side the excess was all in the 4pm - 4;15pm EST "N" period, which is a suspect excess as pointed out by the Shadowtrader. I have marked off the 2day balance period high and low. Look for a break out of it or a fake out.
On the split profile we can see how the market failed to break out in D period and that was followed by the rally. It is hard to recognize these things in real time so it is important to be on top of your game as the day unfolds. We can also see how the prominent POC was formed with the J/K period lows forming kind of a line in the sand for us today. Look for POC to be touched, single prints to be cleaned up and hopefully a resolution outside of the balance area.
The O/N inventory is almost balanced and we would be opening within the 2-day balance area. The O/N high was outside of the balance area so look out for a test of it. If we are going break out of balance then the O/N high needs to be taken out with high confidence.
Good luck to all
the profile looks very stretched right now so we might expect some retracement before any possible move above. already have 3 distributions on the day
so far the market is staying above the 2-day balance area. the more time we spend up here, the higher chances of taking out ONH and moving up
last week's high is 2100.75 and the high was poor being 2 TPOs wide, which means that it needs to be cleaned up. we are also now above last week's VAH
feels like pressure is building for newer highs...
interesting note... the current VPOC on the day is still down at 2076.25
we have been coiling for the past hour or so... look for a breakout
the market is really struggling to move any higher.... if we dont see a move up soon, then a liquidation break could follow by end of the day
looks like they hit some stops.... lets see if the run upwards continues or not
next are greenies at 98 and 2104.25
next are greenies at 98 and 2104.25
at the 2098 greenie. if we are to move up then next references are last week's high mentioned earlier and then the 2104.25
i need to get back to the standard deviation study so that we have a better idea of where the market is statistically
i need to get back to the standard deviation study so that we have a better idea of where the market is statistically
i have a suspicion that it will hit 2100 and roll over
Emini Day Trading /
Daily Notes /
Forecast /
Economic Events /
Search /
Terms and Conditions /
Disclaimer /
Books /
Online Books /
Site Map /
Contact /
Privacy Policy /
Links /
About /
Day Trading Forum /
Investment Calculators /
Pivot Point Calculator /
Market Profile Generator /
Fibonacci Calculator /
Mailing List /
Advertise Here /
Articles /
Financial Terms /
Brokers /
Software /
Holidays /
Stock Split Calendar /
Mortgage Calculator /
Donate
Copyright © 2004-2023, MyPivots. All rights reserved.
Copyright © 2004-2023, MyPivots. All rights reserved.


