ES Monday 8-17-15
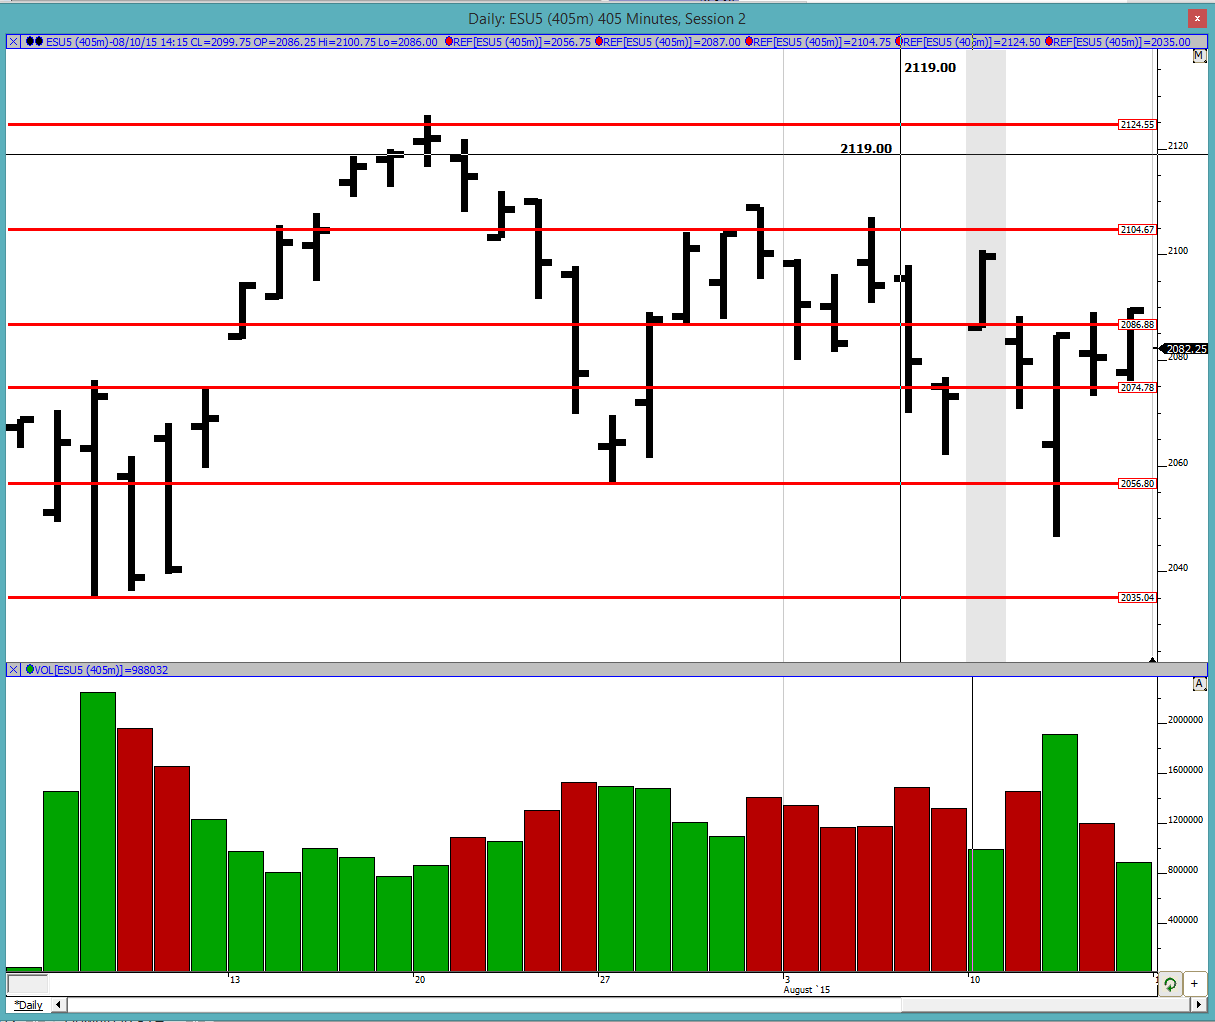
Good morning to all. We continue being in the bigger trading range and now also have a smaller 2 day balance. In these 2 days of balance we have had higher highs and higher lows but they are relatively close to each other so look for a break out of balance in either direction or even a fake out.
Greenies (past naked developing VPOCs): 2051.5, 2053.75, 2082.25, 2087.75, 2090.25, 2092.75, 2096.75, 2098, 2104.25, 2112.75, 2118.75 and 2123.5
Profile:
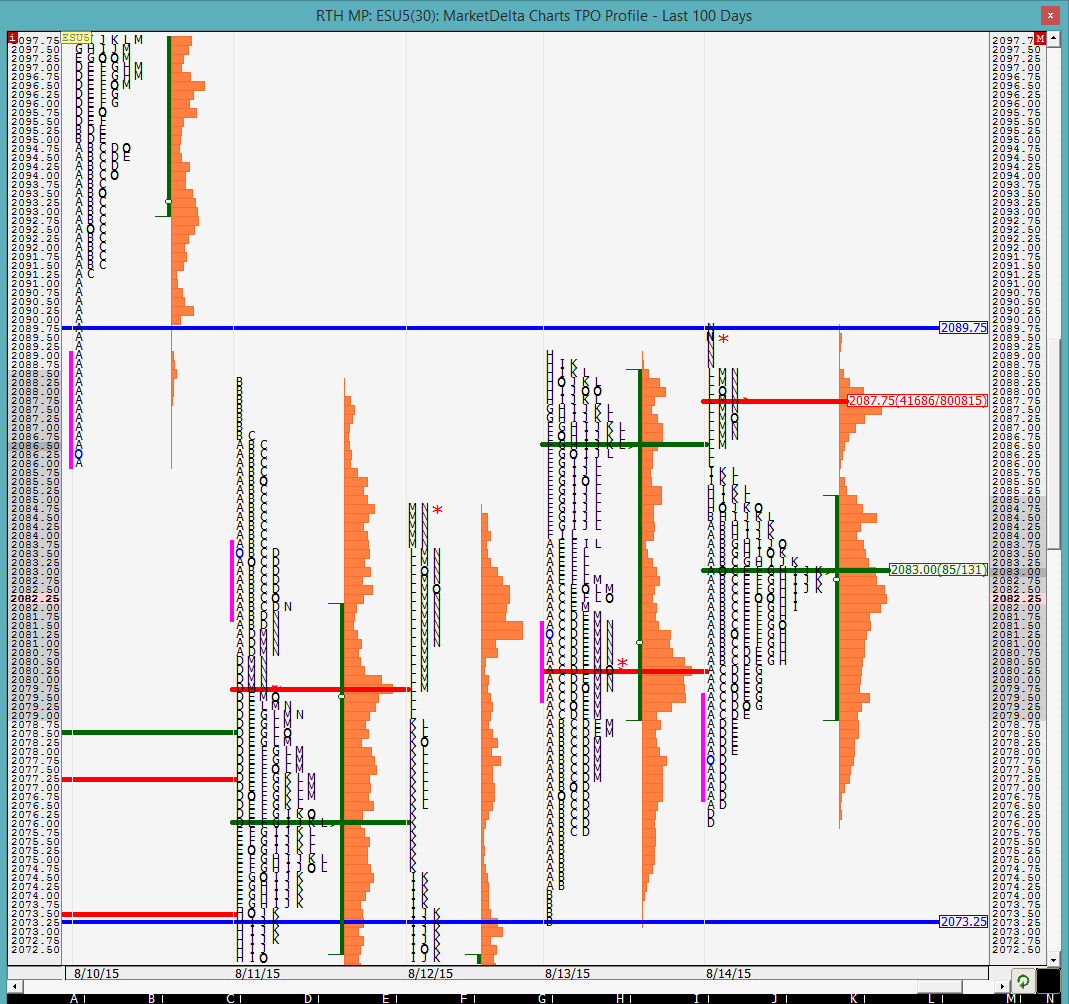
Friday was kind of a double distribution day with the separation by the 2 single prints in the L period with a prominent POC on the south of it and the VPOC on north of it. Conventional knowledge says that the prominent POC would be revisited at some point as well as the VPOC becomes a greenie. Technically we have enough excess on the lower side due to the 2 ticks in D period. On the upper side the excess was all in the 4pm - 4;15pm EST "N" period, which is a suspect excess as pointed out by the Shadowtrader. I have marked off the 2day balance period high and low. Look for a break out of it or a fake out.
On the split profile we can see how the market failed to break out in D period and that was followed by the rally. It is hard to recognize these things in real time so it is important to be on top of your game as the day unfolds. We can also see how the prominent POC was formed with the J/K period lows forming kind of a line in the sand for us today. Look for POC to be touched, single prints to be cleaned up and hopefully a resolution outside of the balance area.
The O/N inventory is almost balanced and we would be opening within the 2-day balance area. The O/N high was outside of the balance area so look out for a test of it. If we are going break out of balance then the O/N high needs to be taken out with high confidence.
Good luck to all
approaching the lower end of the balance area quickly
30 min VPOC @ 2076
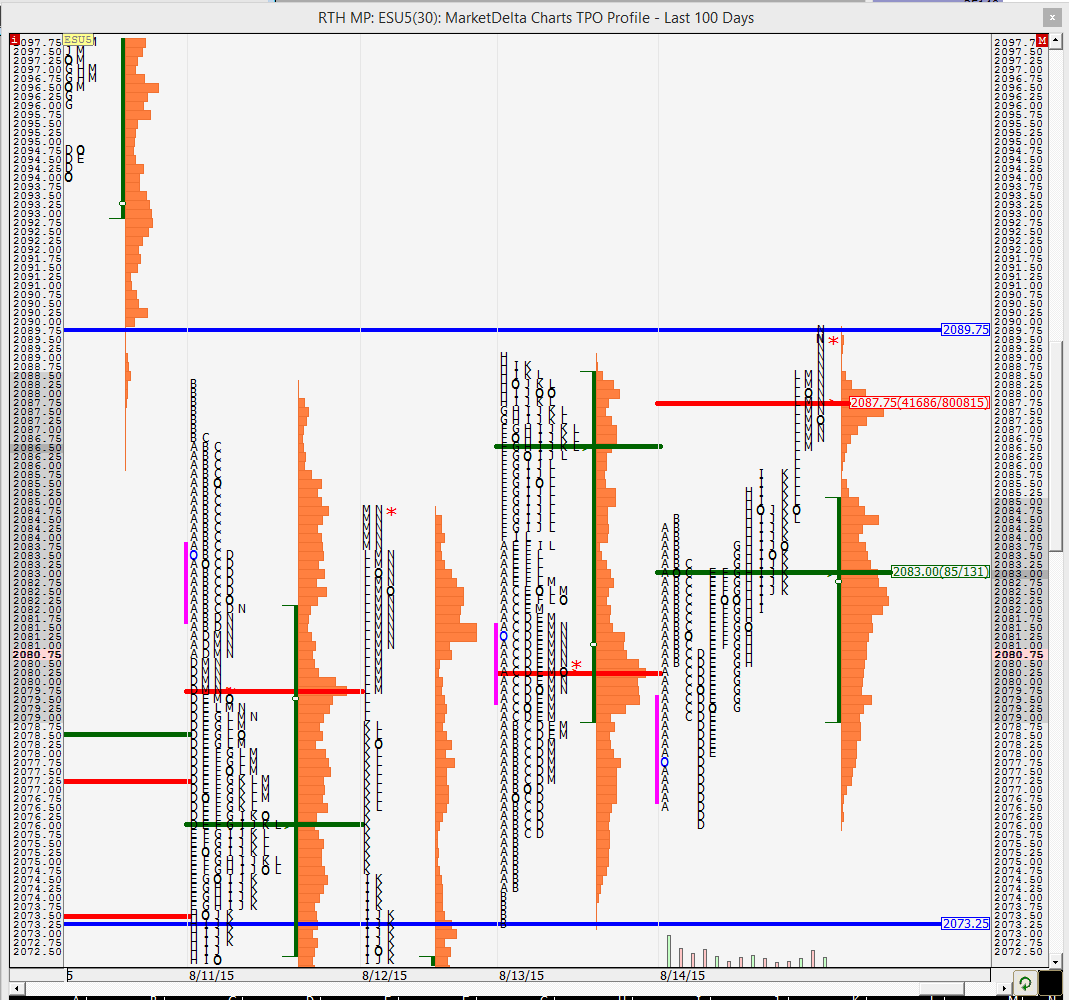
2087 reached and now we are approaching the balance area high. notice how we got close to the balance area low but found buyers even before we could reach it
will the double distribution through the single prints in B period hold or will the singles be covered?
new kid hope things r good and good work as always too..question is how do you figure out if the over night is long or short or just balance? 2nd question is i may be confuse on the term here but one of your post said "approaching the lower end of the balance area quickly" which price was around 76 area of post..isnt the balance low at 80.75
tia
duck
tia
duck
Duck, look at the picture below. I was referring to the 2 day balance, which is Thursday's low and Friday's high. Thursday's low was 2073.25 (marked in blue). We came to 2076 and bounced from it. So we did not even get to the 2073.25. That is what I meant by my comment
as for your other question, the way Dalton describes overnight inventory is to draw a line at the close of the previous day and then see on which side was the overnight action occurring. if most of the action was above the previous close then overnight inventory is considered long. conversely if the action is below the close, then it is considered short and if it even around the close then it is considered balance. The idea behind is that sometimes opposite action of the overnight inventory needs to occur at the open and to look out for that. for example if the inventory is long, one can expect some liquidation at the open. that usually explains some of the early trade on RTH open
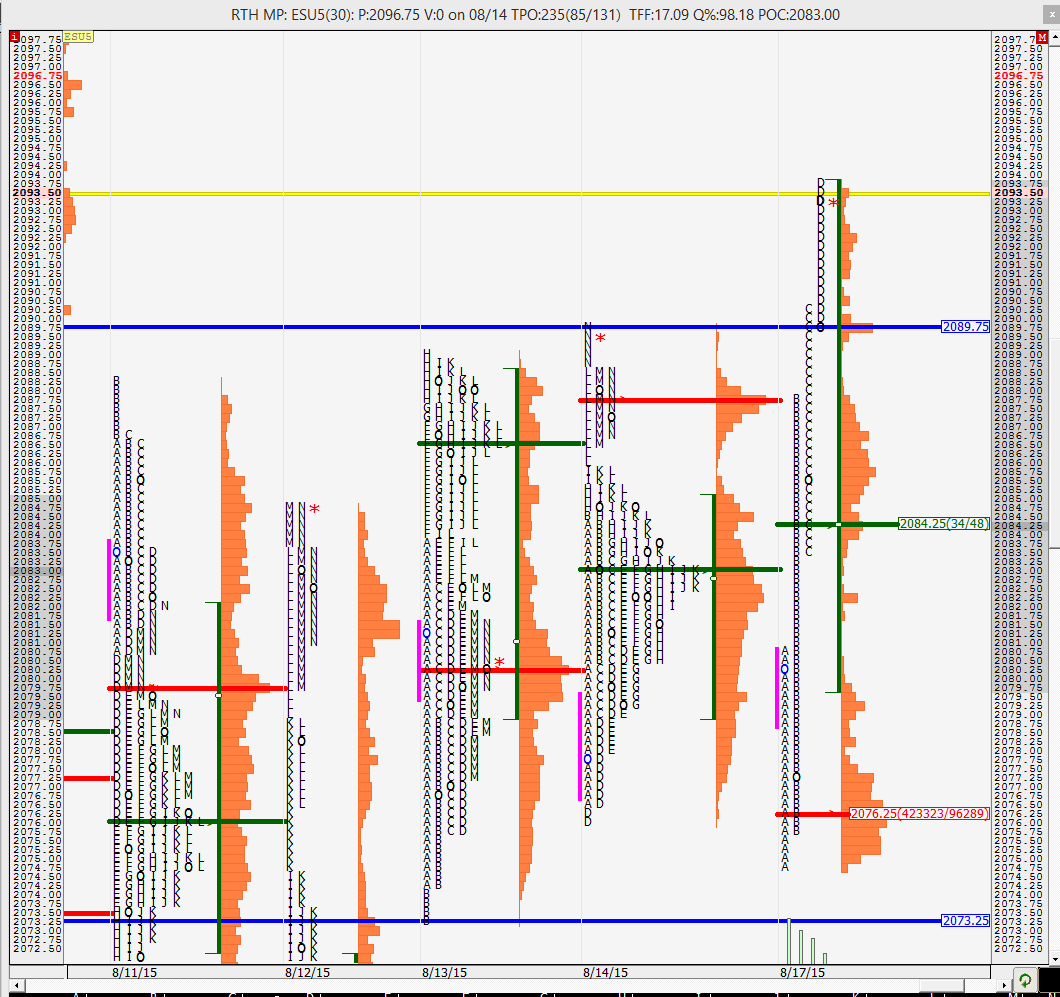
we are now above the 2 day balance area high of 2089.75 and approaching the O/N high. The O/N high is where some traders usually fade so there might be a pause coming up. the breakout will be confirmed if we start spending more time above 2089.75 and then break out of the O/N high convincingly and stay above it. else there is risk of falling back into balance. lets see how strong the buying is
thanks nk for me answer
i have a suspicion that it will hit 2100 and roll over
Emini Day Trading /
Daily Notes /
Forecast /
Economic Events /
Search /
Terms and Conditions /
Disclaimer /
Books /
Online Books /
Site Map /
Contact /
Privacy Policy /
Links /
About /
Day Trading Forum /
Investment Calculators /
Pivot Point Calculator /
Market Profile Generator /
Fibonacci Calculator /
Mailing List /
Advertise Here /
Articles /
Financial Terms /
Brokers /
Software /
Holidays /
Stock Split Calendar /
Mortgage Calculator /
Donate
Copyright © 2004-2023, MyPivots. All rights reserved.
Copyright © 2004-2023, MyPivots. All rights reserved.


