ES Tuesday 12-3-13
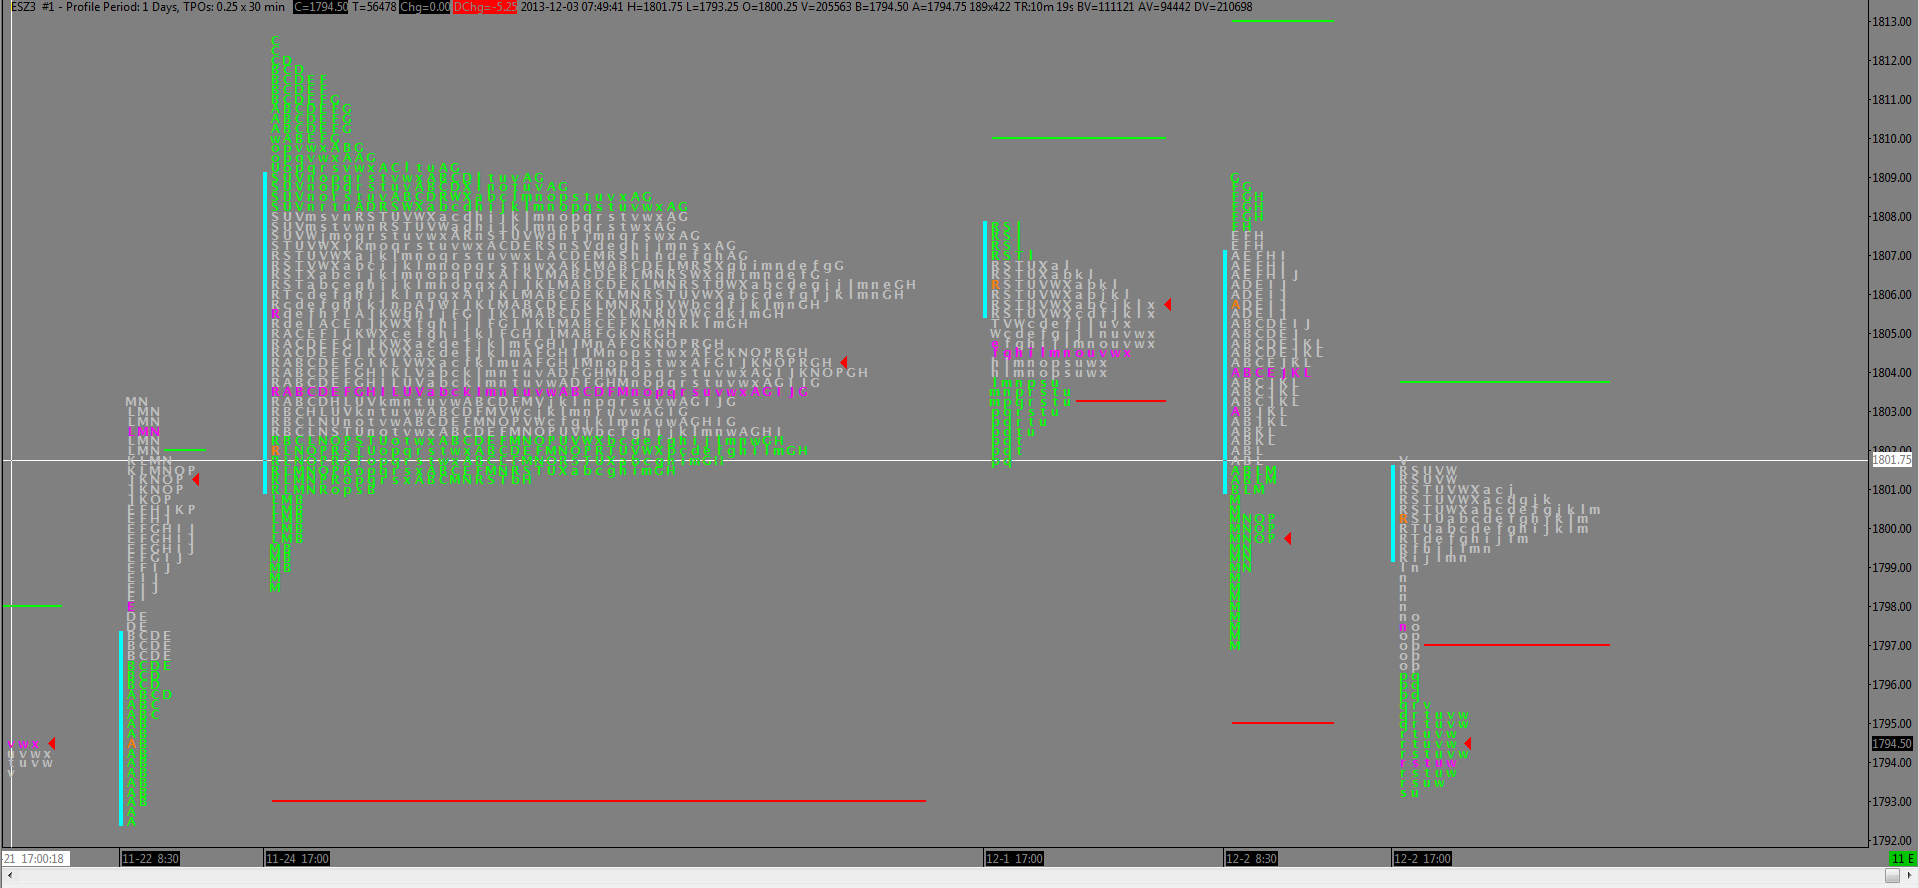
Attached is the same profile from yesterday showing last week as a combined balance area. To the right you have the Sun/Mon overnight and then Monday's session showing balance until late in the session when it sold off below that critical 0100 number. Then we have the current overnight showing continuation below the 0100 area.
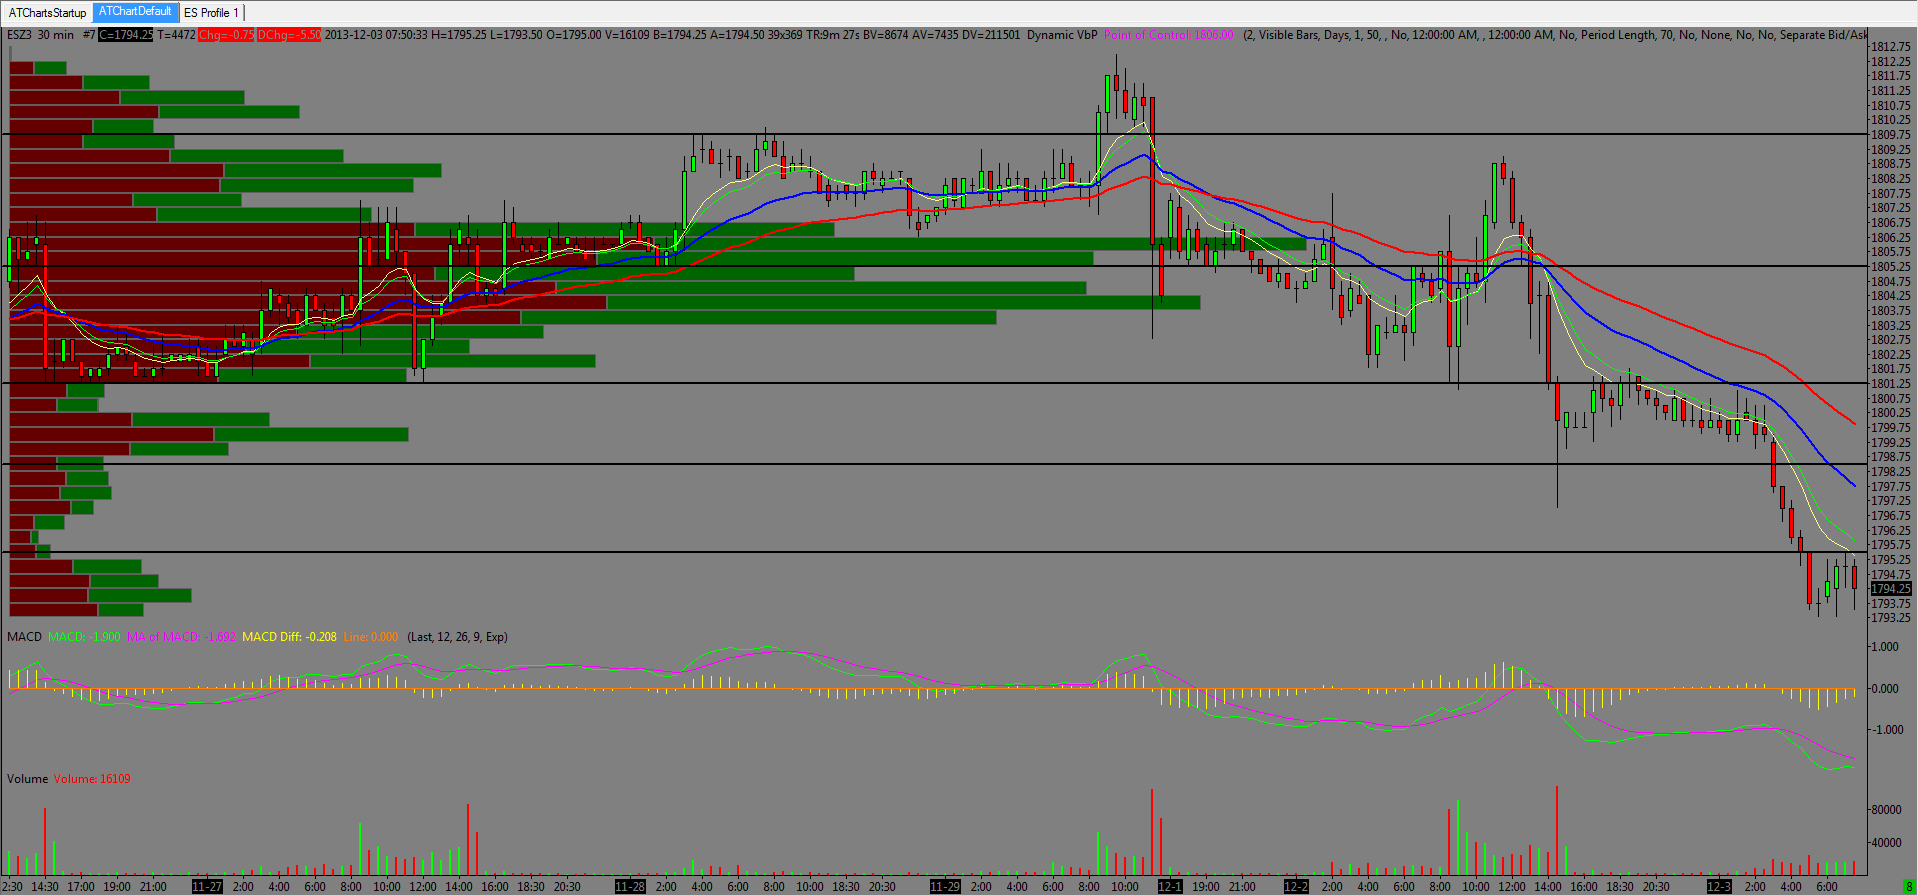
Then we have the current 30 minute which show the breakdown overnight. The lines snapped at 9850 and 9550 were LVMs from earlier in November. We went right thru both and now the 9550 acts as resistance.
Did we get too short overnight? Dunno.
Below this I have the NVPOC at 90.75 and an 8850 LVM. That 92-9250 area was also a key number.
nice short trade bkay !
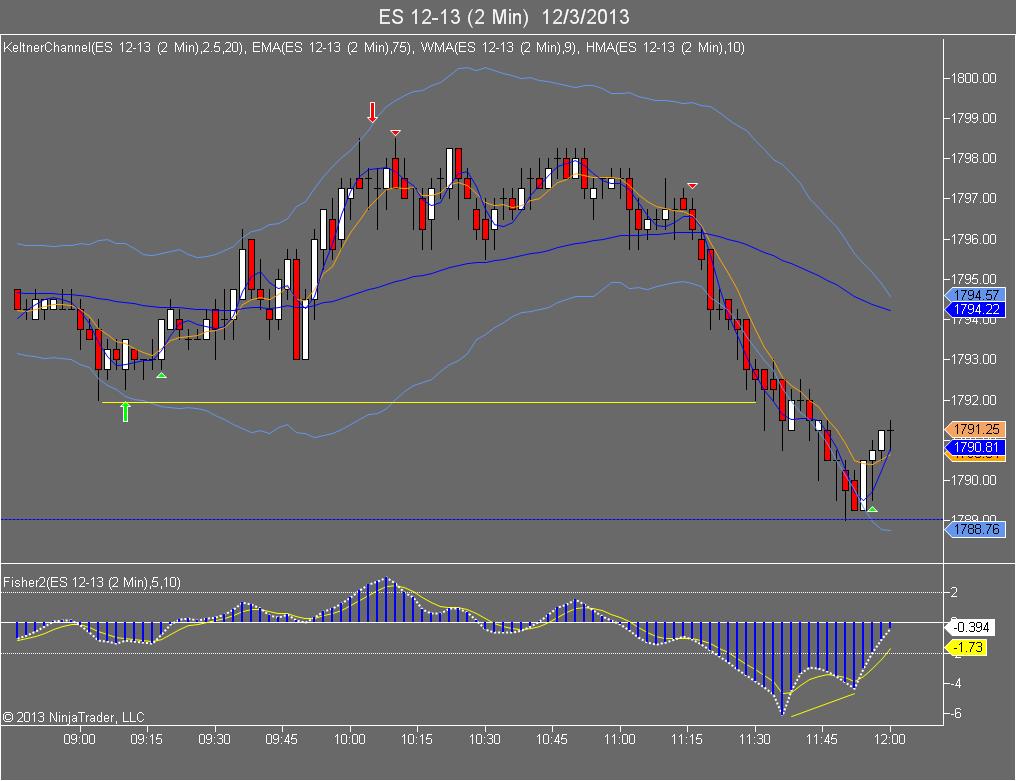
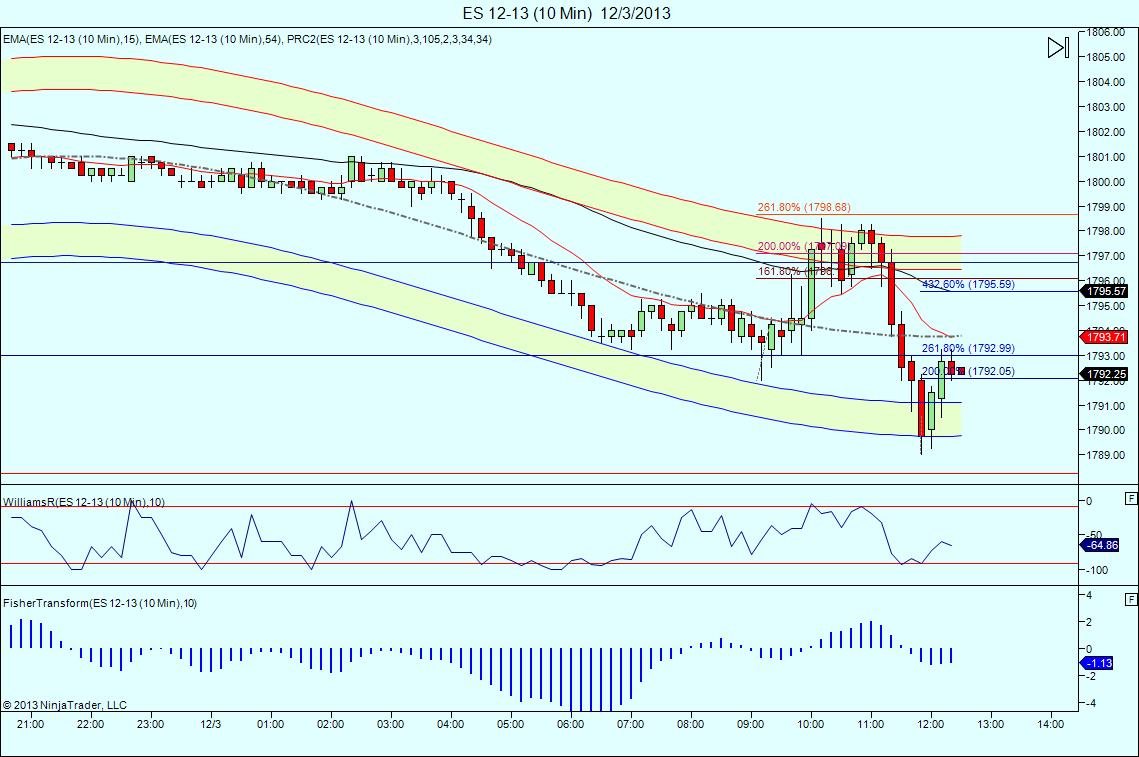
fisher divergence at 89 support line
looking for a decent bounce back to the blue line on this chart...
fisher divergence at 89 support line
looking for a decent bounce back to the blue line on this chart...
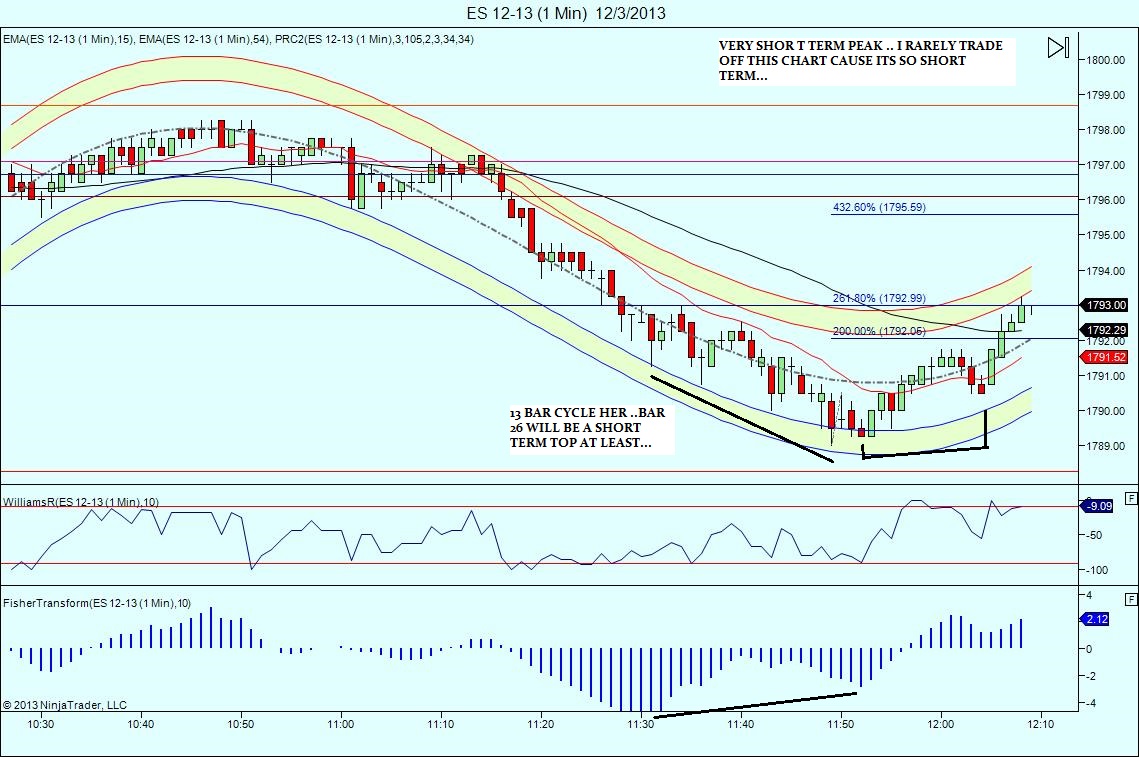
1793.00 would be the current short term upside projection for me...
So in my never ending battle with placing stops, I set mine at 9275 after hitting my first target, Why? because I felt strongly about that 9200 number and if it should provide resistance then failure above there takes me out. Then after hitting my second target I moved to BE minus a tick. My logic of 9200 holding gives way to "don't give anything back". Had I that 8900 level that PT has I may have made my last target 8925.
Moot now that we are well above those levels. However, "live to fight another battle"
Moot now that we are well above those levels. However, "live to fight another battle"
Originally posted by koolblue
1793.00 would be the current short term upside projection for me...
works for me Kool !
Definitely lunch time "no trade zone" for me
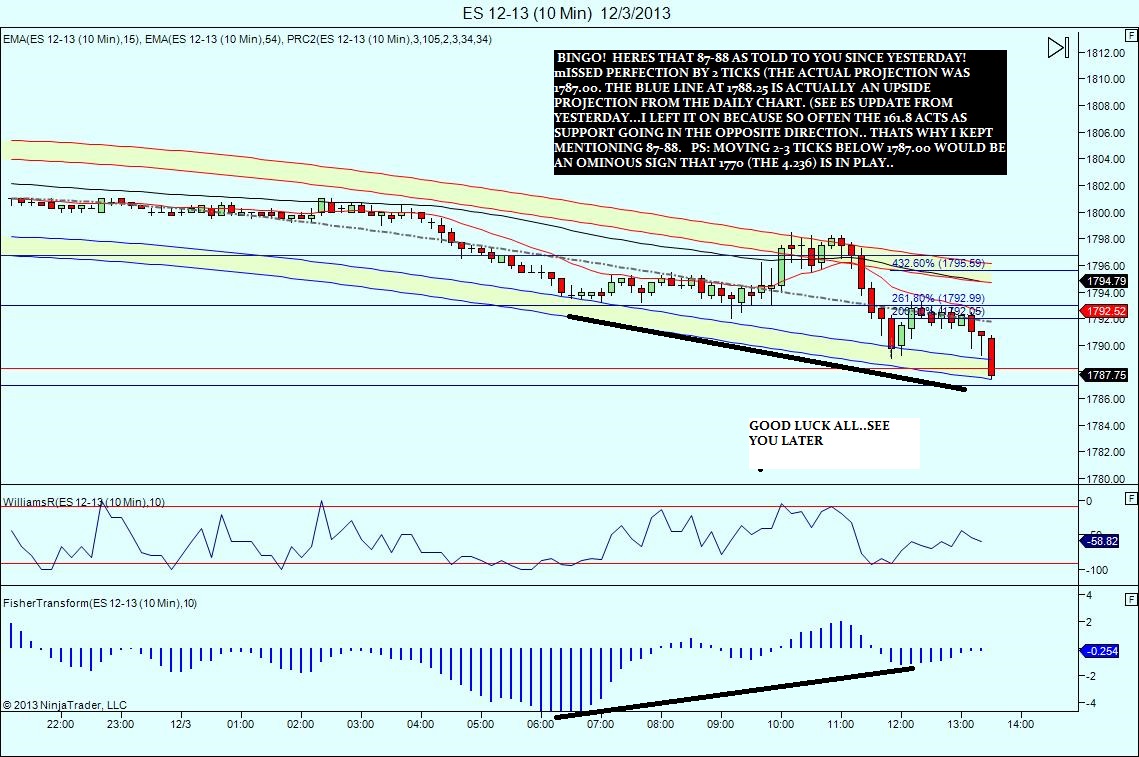
Here is a ten min update.. note the massive positive divergence pointed out by PT... it would be very rare for me to miss a projection by one full handle, (1789.00 as opposed to 87-88) but it does happen...note also the midline and red avg at PT s 1794.. Any way , im done for the day.. but a very interested observer . I just dont think we get this close to the 261.8 projection and not get it..(1787)
see how shes having trouble getting thru that 1793 ? Could eventually go to 1795.50 if they do break thru.. and that is where the black avg is..
Originally posted by bkay59
So in my never ending battle with placing stops, I set mine at 9275 after hitting my first target, Why? because I felt strongly about that 9200 number and if it should provide resistance then failure above there takes me out. Then after hitting my second target I moved to BE minus a tick. My logic of 9200 holding gives way to "don't give anything back". Had I that 8900 level that PT has I may have made my last target 8925.
Moot now that we are well above those levels. However, "live to fight another battle"
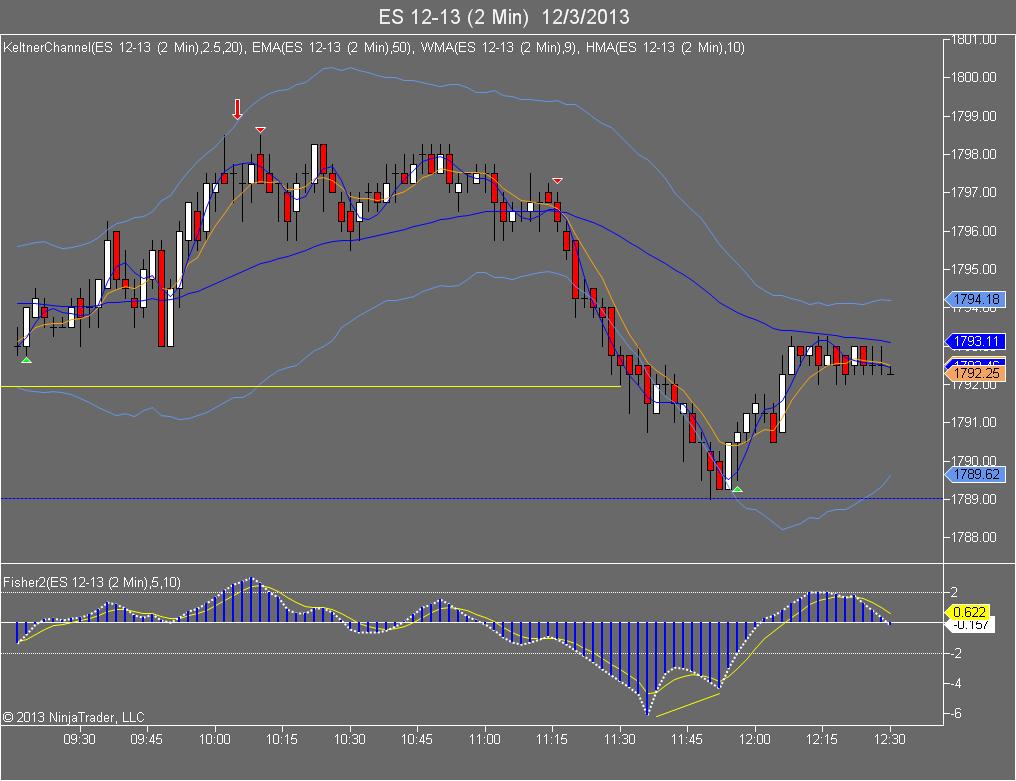
that 89 level "popped up" on my 2 minute chart all of a sudden when price worked it's way down there...
I am not a proponent of BE stops. I think if you do the underlying math on BE stops in the ES (scalping) they just don't hold up to scrutiny. Better to go all in / all out than use a BE stop. If you are going to trail a stop and scale out along the way, it is better (more profitable) to maintain a constant stop distance as price moves in your favor. So for example, if your initial stop is 8 ticks, it is better to maintain that 8 tick distance from start to finish, and scale out of your contracts as you hit your various targets along the way in the trend. Anytime you step in and arbitrarily reduce the stop distance, like going from 8 tick stop to a 3 or 4 tick (breakeven) stop, you increase the probability the stop will be hit prematurely. In a winning trade we need to give it room and let it run.
Update on 2 minute... target reached...
Emini Day Trading /
Daily Notes /
Forecast /
Economic Events /
Search /
Terms and Conditions /
Disclaimer /
Books /
Online Books /
Site Map /
Contact /
Privacy Policy /
Links /
About /
Day Trading Forum /
Investment Calculators /
Pivot Point Calculator /
Market Profile Generator /
Fibonacci Calculator /
Mailing List /
Advertise Here /
Articles /
Financial Terms /
Brokers /
Software /
Holidays /
Stock Split Calendar /
Mortgage Calculator /
Donate
Copyright © 2004-2023, MyPivots. All rights reserved.
Copyright © 2004-2023, MyPivots. All rights reserved.
