ES Tuesday 12-3-13
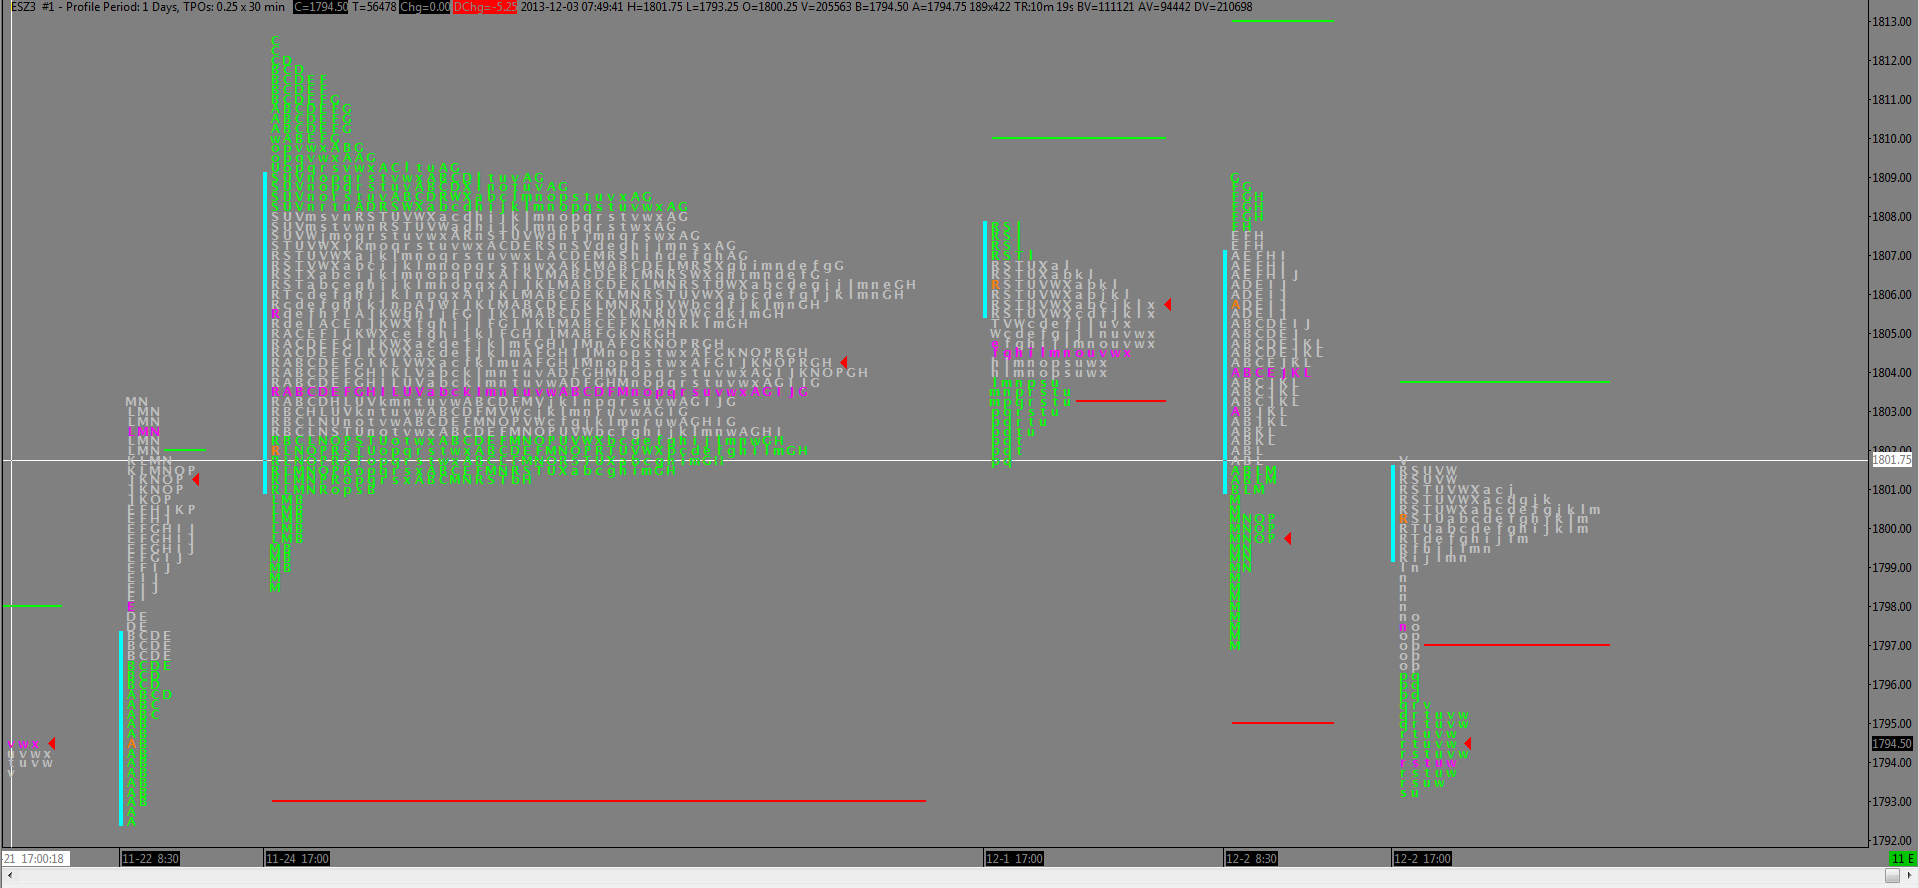
Attached is the same profile from yesterday showing last week as a combined balance area. To the right you have the Sun/Mon overnight and then Monday's session showing balance until late in the session when it sold off below that critical 0100 number. Then we have the current overnight showing continuation below the 0100 area.
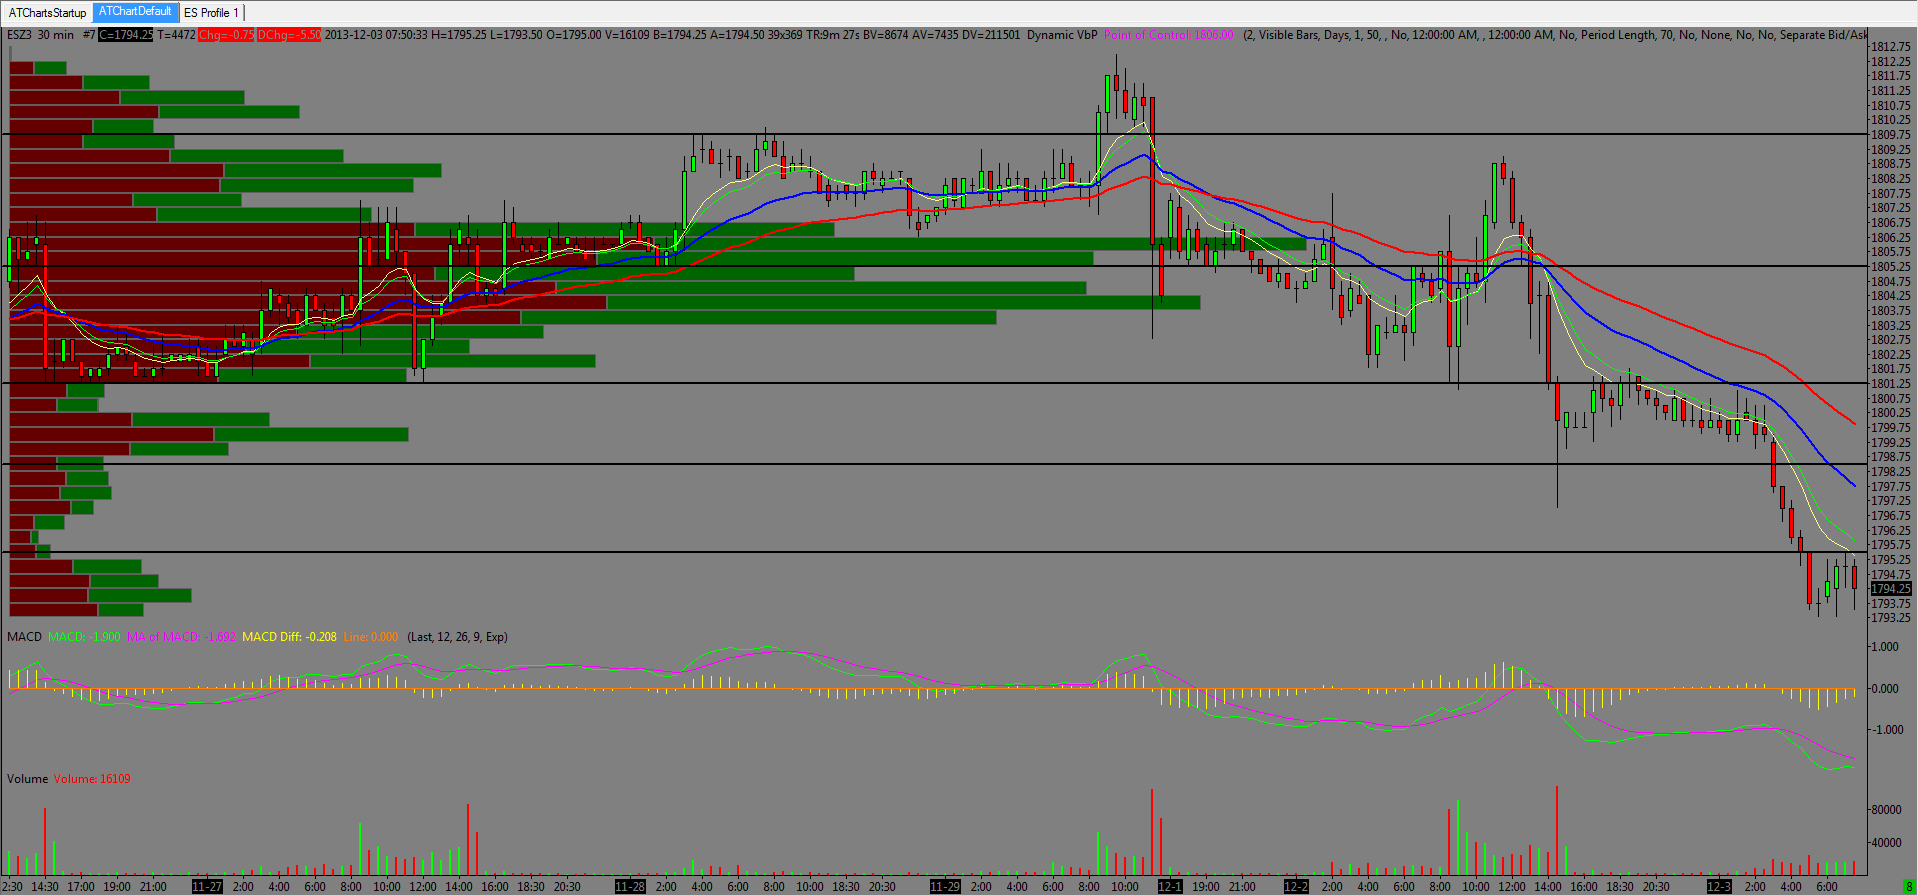
Then we have the current 30 minute which show the breakdown overnight. The lines snapped at 9850 and 9550 were LVMs from earlier in November. We went right thru both and now the 9550 acts as resistance.
Did we get too short overnight? Dunno.
Below this I have the NVPOC at 90.75 and an 8850 LVM. That 92-9250 area was also a key number.
Yeah I took It, we'll see short from 9175
Took out that NVOPOC at 90.75, would've like to see a push through that
there we go
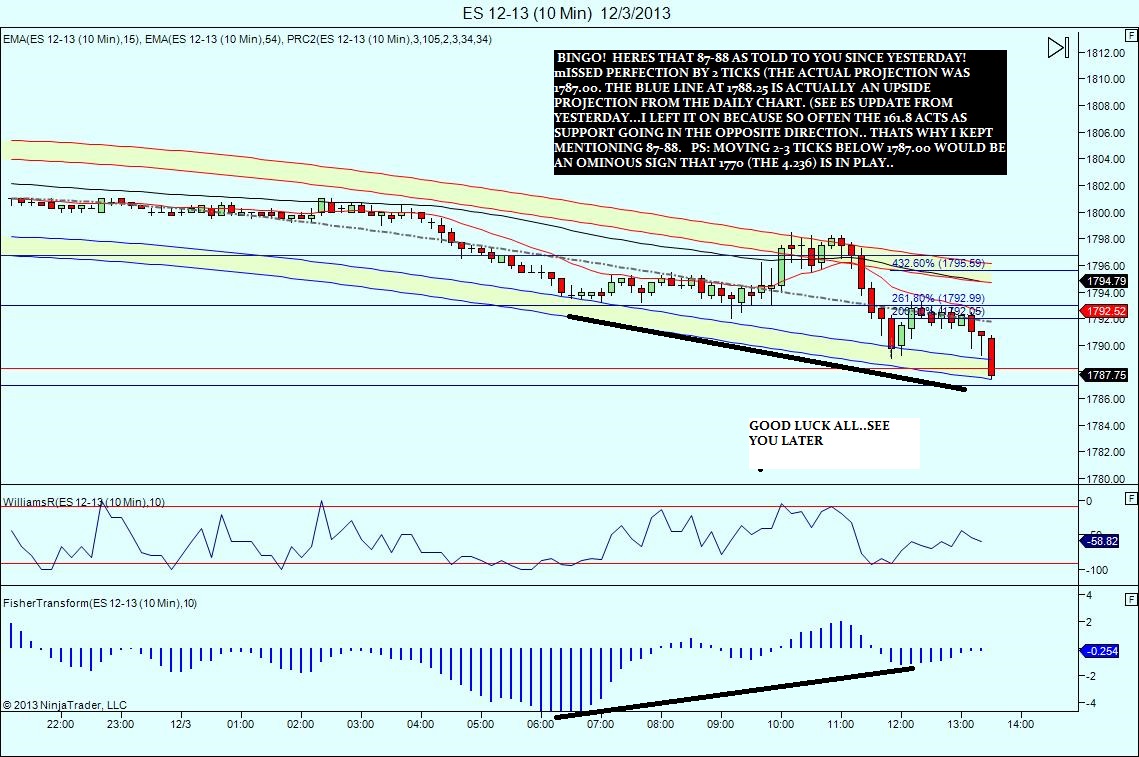
i think we go sideways now for the lunch hour.. we are at the lower band on the ten min chart and it needs a little time to bend downward before we can go much farther. At least thats what usually happens.. still think we see 87-88 later
ok, got my first two targets, now my runners at BE, so I'm good
Great job Bkay
the cycle from the 1798.50 top recently should be bottoming this ten min bar..if i was a short still id think about covering
but yes its obvious to me that we will see 87-88 eventually..
gonna try for 88.75, I have a level at 8850
Runner stopped at 91.50
Emini Day Trading /
Daily Notes /
Forecast /
Economic Events /
Search /
Terms and Conditions /
Disclaimer /
Books /
Online Books /
Site Map /
Contact /
Privacy Policy /
Links /
About /
Day Trading Forum /
Investment Calculators /
Pivot Point Calculator /
Market Profile Generator /
Fibonacci Calculator /
Mailing List /
Advertise Here /
Articles /
Financial Terms /
Brokers /
Software /
Holidays /
Stock Split Calendar /
Mortgage Calculator /
Donate
Copyright © 2004-2023, MyPivots. All rights reserved.
Copyright © 2004-2023, MyPivots. All rights reserved.


