ES Monday 2-27-12
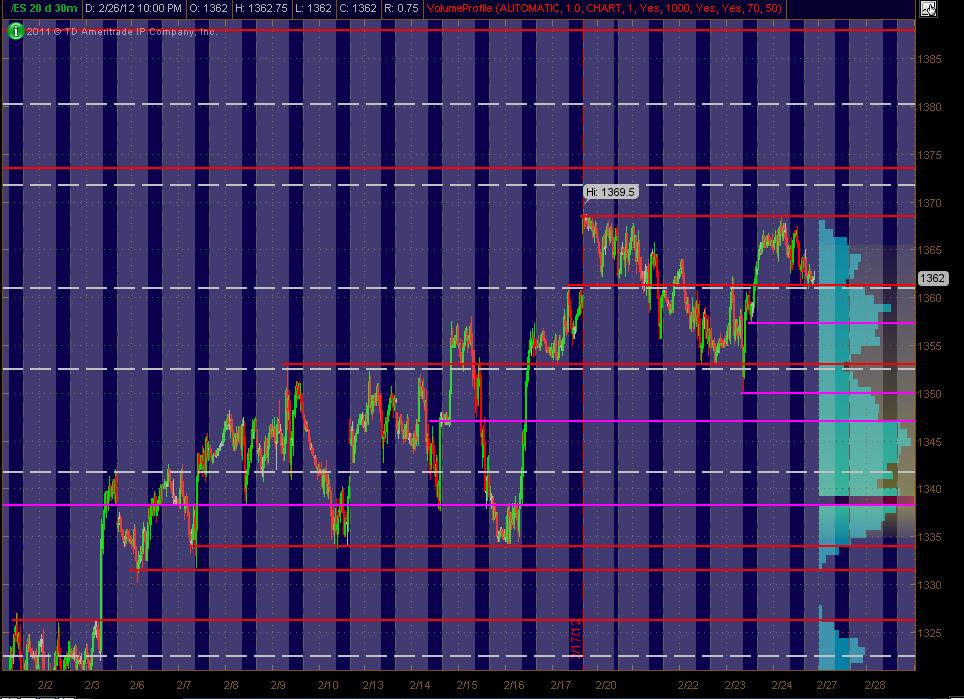
Here's what I've got for my ES MAP of PASR ZONES using a 30min chart of 20 days of data coming into Monday's trading. The Red lines are potential significant levels with Magenta lines as semi-significant. The White dashed lines are the Weekly Pivots (kind of a background thing to have on the chart). The Light Blue Volume Profile of the past "rolling" 20 days is displayed on the right vertical axis. The Gray background shows non-RTH price activity. Hope, as always, that this is helpful to some as a "MAP."
thanks for the response bruce...i remember u mentioned using that matrix but did not know if you were still actively doing it
i find it difficult (mostly mentally) to get in and out multiple times, so sometimes i end up averaging when still in an area of interest after an early entry...don't know if it is the right way to go or not but i haven't found an easier way to participate in trades (without being stopped) even if am a bit early on the entries...once i am in a trade i use a fixed stop most times
thanks once again for such detailed explanation and looking fwd to seeing your footprint chart once again
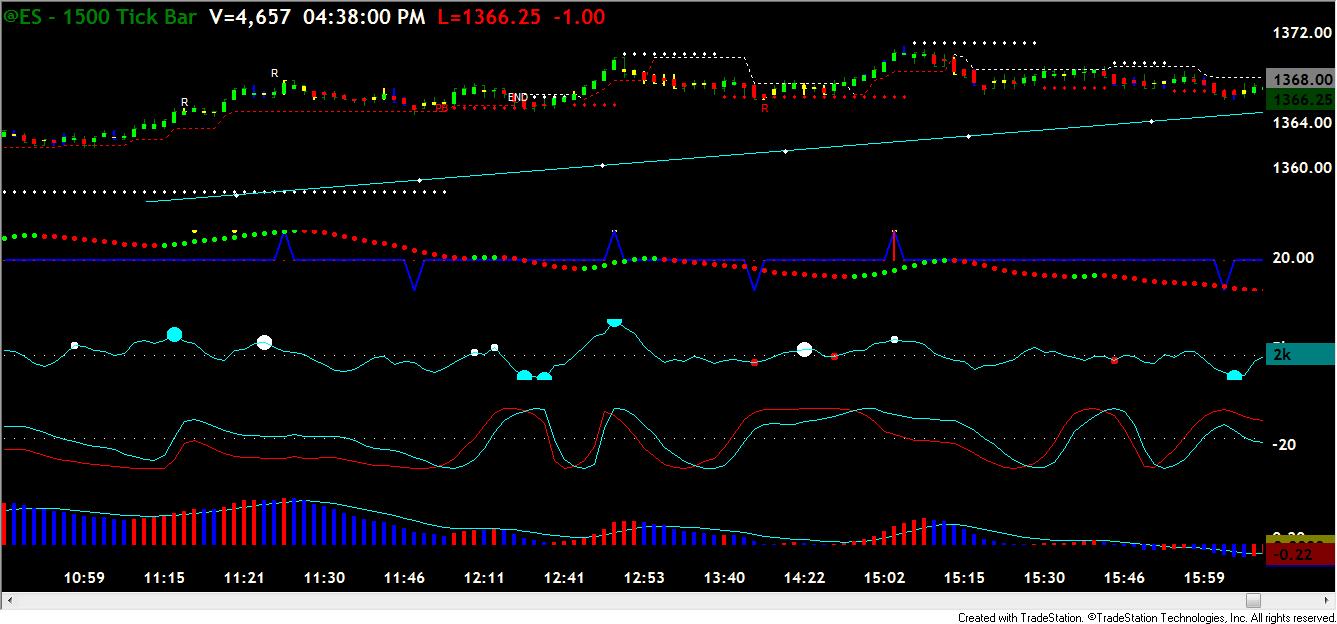
Just some food for thought..1. when everyone is looking for something to happen (like a pullback) it usually doesn't ..My main trading chart is a 1500 tick set to volume...using this chart there are USUALLY(not always)2 significant cycles in a day..sometimes just one..i.e. one straight up or one straight down, and very rarely, like 3 or 4 times a YEAR, there are 3 major cycles in a day. today the first cycle,down, ended around 10 AM, this is very common, and things have been pretty much up since then..so on a day like today especially when some folks REALLY want to see a close a above Dow 13k, presumably to suck in the amatures and scare out the shorts we could conceivably close on the highs of the day...what to do? I took a trade earlier after 10AM betting on the low of the day...the results do not matter because it is ancient history...from here forward? My choice is nothing for now..but if I had to make a bet....probably to the upside...why?..get the 13K close out of the way and because it seems EVERYONE wants to short this thing and probably already has..IF it does move up it could happen quickly as almost EVERYONE has already sold..just one old guy's view of things so please don't get upset if you do not agree....
1370.25 is r1 on the weekly so will try one more fade if we can get a good flip to target 67.25 VPOC
worked out well Bruce
If only they could all work that fast...seems like the afternoon stuff requires a lot more patience usually...not my specialty...more often it wears me down but today was ok.
Those weekly numbers work well usually.
My numbers which are only based on RTH weekly nunbers are
1370.25 R1
1360.17 pivot
and 1352.75 was s1
so the website here uses all session...I still use the RTH only..verdict is still out on the overnight influence in general and haven't seen any good studies comparing the two different methods
not much trend today which is typical for the ES. We had a 90 minute period that rallied 11 points...so that part is a trend no question there...then we had over 300 minutes that just went back and forth in a 5-6 point range...non trend...how many traders gave back money thinking that we would keep trending ? probably too many!
as I type we are up 3.25 points above fridays close...not very impressive..
as I type we are up 3.25 points above fridays close...not very impressive..
thanks for everything today bruce, see ya tomorrow
well up is up..my eyesight may be failing but on my chart that line goes at an up angle...3.25 points up is not that big a deal..unless of course you are short 50 contracts!...just saying..nice night everyone
Emini Day Trading /
Daily Notes /
Forecast /
Economic Events /
Search /
Terms and Conditions /
Disclaimer /
Books /
Online Books /
Site Map /
Contact /
Privacy Policy /
Links /
About /
Day Trading Forum /
Investment Calculators /
Pivot Point Calculator /
Market Profile Generator /
Fibonacci Calculator /
Mailing List /
Advertise Here /
Articles /
Financial Terms /
Brokers /
Software /
Holidays /
Stock Split Calendar /
Mortgage Calculator /
Donate
Copyright © 2004-2023, MyPivots. All rights reserved.
Copyright © 2004-2023, MyPivots. All rights reserved.

