ES Wednesday 2-8-12
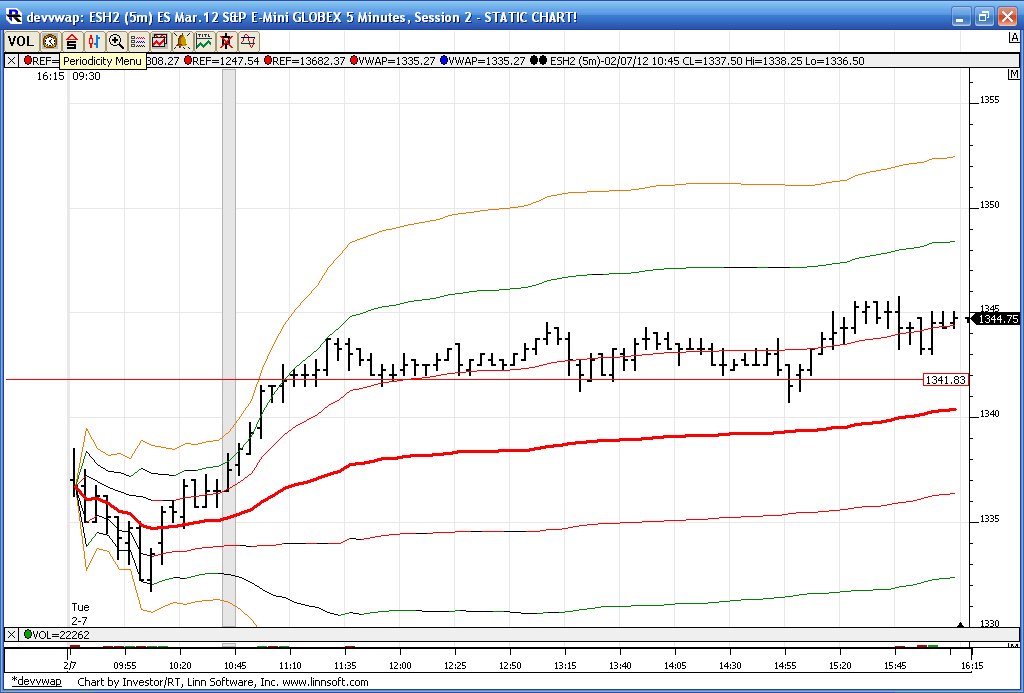
Here is a look at yesterdays trade with the vwap bands and Video. I decided that in many ways video is becoming faster than typing for me...The current Overnight high of 48.25 now has come in right at a vwap band so that confirms that band.
other areas....
Overnight VPOC at 47.....so 47 - 48.25 becomes key resistance
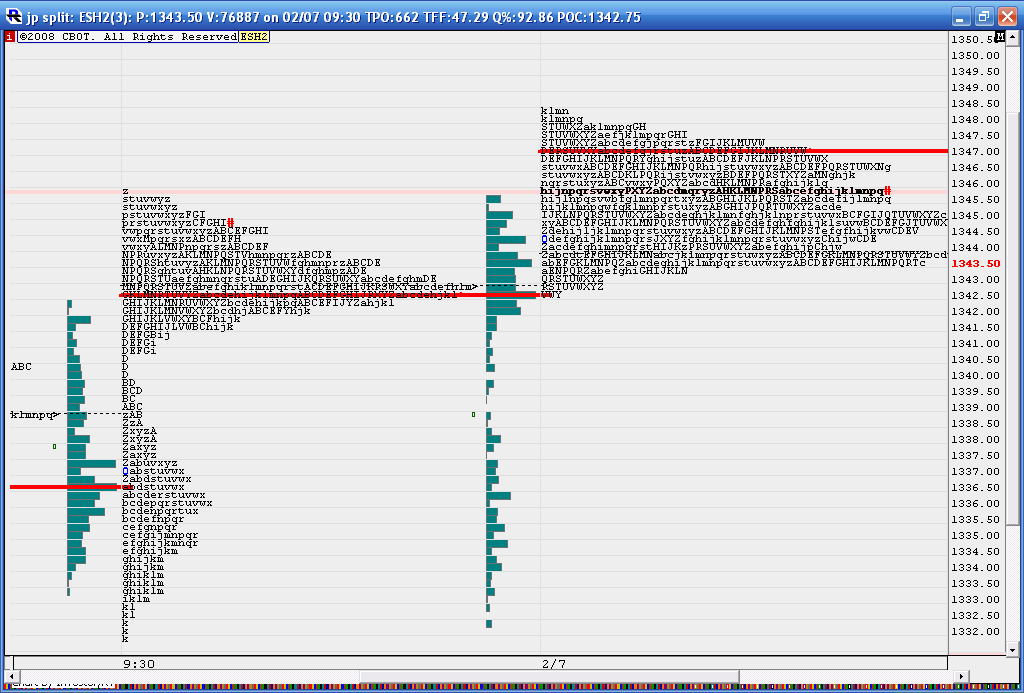
Time is being spent in the 45 area ...so that is attracting price but I will not use that to initiate from unless some pitbull number matches up...would prefer to use that as a target..then we have the evil 42.50 from yesterday which matches the Overnight low and then we have low volume beginning at 1340 which goes well with closing vwap....
below there I will not buy unless we get below 1336
some charts for reference:
Closing Vwap
Overnight against yesterdays day session
Video explanation:
lots of volume coming in here...will try one more time from 39 and won't try again
every morning I take 3 pictures
1) previous day's RTH Volume Profile
2) Overnight volume profile
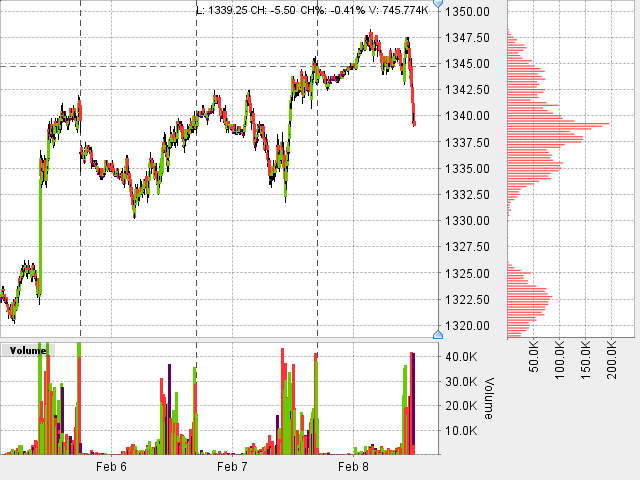
3) 5 days of volume profile.
I am trying to learn what I can about the volume profiles
current print is of great interest (ES 1339) because this is the Volume POC of the past 5 days. (I also notice that the same double bell is apparent in the volume profile.
very cool Paul....
trying to get out at 42 ...ahead of air pocket and the evil 42.50 from yesterday...not convinced we caught the low yet
trying to get out at 42 ...ahead of air pocket and the evil 42.50 from yesterday...not convinced we caught the low yet
Bruce,
Just wondering how you interpret volume like this? We see this often where see a break away from a previous HV area. Then finally trade some volume at another spot. Having trouble understanding if we are reversing, building value/acceptance in a new level, or initiating more volume in the current direction.
Thanks!
Originally posted by BruceM
lots of volume coming in here...will try one more time from 39 and won't try again
trade back down to 39 even will stop this out...target is lowered now to 41 if we get lucky.....would have liked to see more immediate rejection of this area
great question and unfortunately I don't have any great answers...I'm just a grunt day trader and have had little luck in fiquring out VPOC shifts and what consolidation shifts really mean...so I stick to just taking the short term trades...
I basically just buy and sell off the ranges and LOW volume areas....we never know what the bigger plan really is but sometimes we get lucky on runners....sorry I don;t have a better answer
I basically just buy and sell off the ranges and LOW volume areas....we never know what the bigger plan really is but sometimes we get lucky on runners....sorry I don;t have a better answer
Originally posted by Sangeo
Bruce,
Just wondering how you interpret volume like this? We see this often where see a break away from a previous HV area. Then finally trade some volume at another spot. Having trouble understanding if we are reversing, building value/acceptance in a new level, or initiating more volume in the current direction.
Thanks!
Originally posted by BruceM
lots of volume coming in here...will try one more time from 39 and won't try again
trying one more time from 38.75...hopefully not suckering me in again
Thanks Bruce! I've tried to interpret the DOM or footprints. Sometimes there are clues but mostly headfakes. Volume is the key and seems like there's no substitute for screentime and some painful payment of dues. Working on being a grunt myself...lol!
Originally posted by BruceM
great question and unfortunately I don't have any great answers...I'm just a grunt day trader and have had little luck in figuring out VPOC shifts and what consolidation shifts really mean...so I stick to just taking the short term trades...
I basically just buy and sell off the ranges and LOW volume areas....we never know what the bigger plan really is but sometimes we get lucky on runners....sorry I don;t have a better answerOriginally posted by Sangeo
Bruce,
Just wondering how you interpret volume like this? We see this often where see a break away from a previous HV area. Then finally trade some volume at another spot. Having trouble understanding if we are reversing, building value/acceptance in a new level, or initiating more volume in the current direction.
Thanks!
Originally posted by BruceM
lots of volume coming in here...will try one more time from 39 and won't try again
just covered runner at 42.25......this zone ( 42.50 - 45 ) is now a sell zone
Bruce,
5 min bars, air down bar ending at 11:05am, low was 42.25, close was 42.75
at what price would say the air is filled?
low of first bar to left of air down bar (43.75)
low of 3rd bar to left of air down bar (43.25)
5 min bars, air down bar ending at 11:05am, low was 42.25, close was 42.75
at what price would say the air is filled?
low of first bar to left of air down bar (43.75)
low of 3rd bar to left of air down bar (43.25)
Ill try to show later , probably tomorrow why i think timewise the ideal time for a price peak would likely be next week between the 14th and 16th. Im expecting bullish behavior untill then ,so caution is advised on all short sales
Emini Day Trading /
Daily Notes /
Forecast /
Economic Events /
Search /
Terms and Conditions /
Disclaimer /
Books /
Online Books /
Site Map /
Contact /
Privacy Policy /
Links /
About /
Day Trading Forum /
Investment Calculators /
Pivot Point Calculator /
Market Profile Generator /
Fibonacci Calculator /
Mailing List /
Advertise Here /
Articles /
Financial Terms /
Brokers /
Software /
Holidays /
Stock Split Calendar /
Mortgage Calculator /
Donate
Copyright © 2004-2023, MyPivots. All rights reserved.
Copyright © 2004-2023, MyPivots. All rights reserved.


