ES Friday 11-4-11
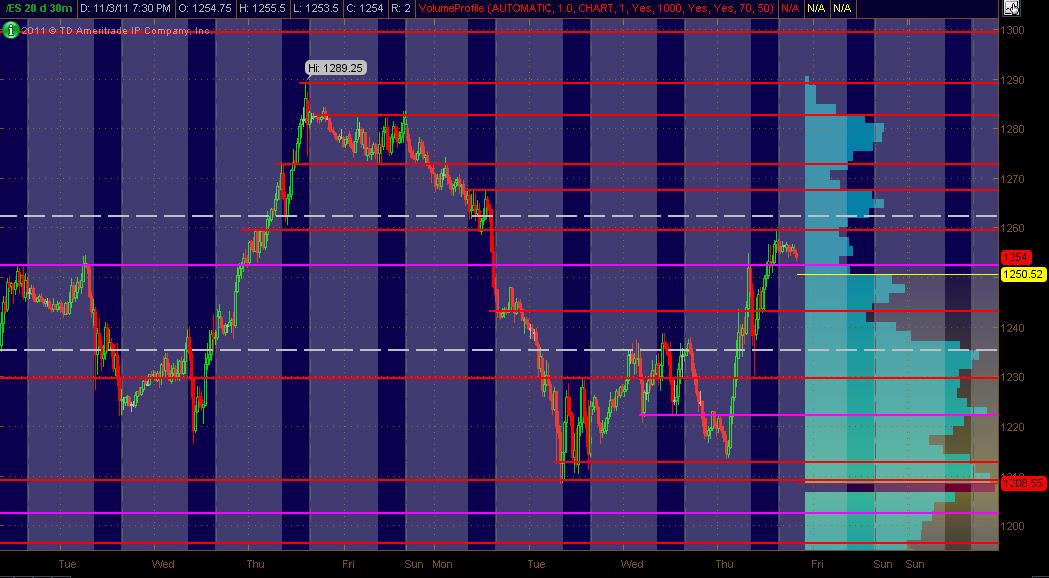
Here's my updated Monkey Map of 20-days worth of 30min chart action displaying All Trading Hours as a for what I'm looking at coming into Friday. The Red lines are potential significant PASR levels with Magenta lines being semi-significant. The White dashed lines are the Wkly Pivots. The right vertical axis shows 20 days of Volume Profile in Light Blue. The background displays RTH in Blue with "after hours" in Gray. As always, I hope this is helpful for some folks.
With the mkt being so news driven lately ... gotta take the levels/zones with a grain of salt and watch what price action is doing when it nears any ZONE.
With the mkt being so news driven lately ... gotta take the levels/zones with a grain of salt and watch what price action is doing when it nears any ZONE.
Price action along with the other data I mentioned told you 36 was a buy.. how far? not sure.. hope to get lucky...
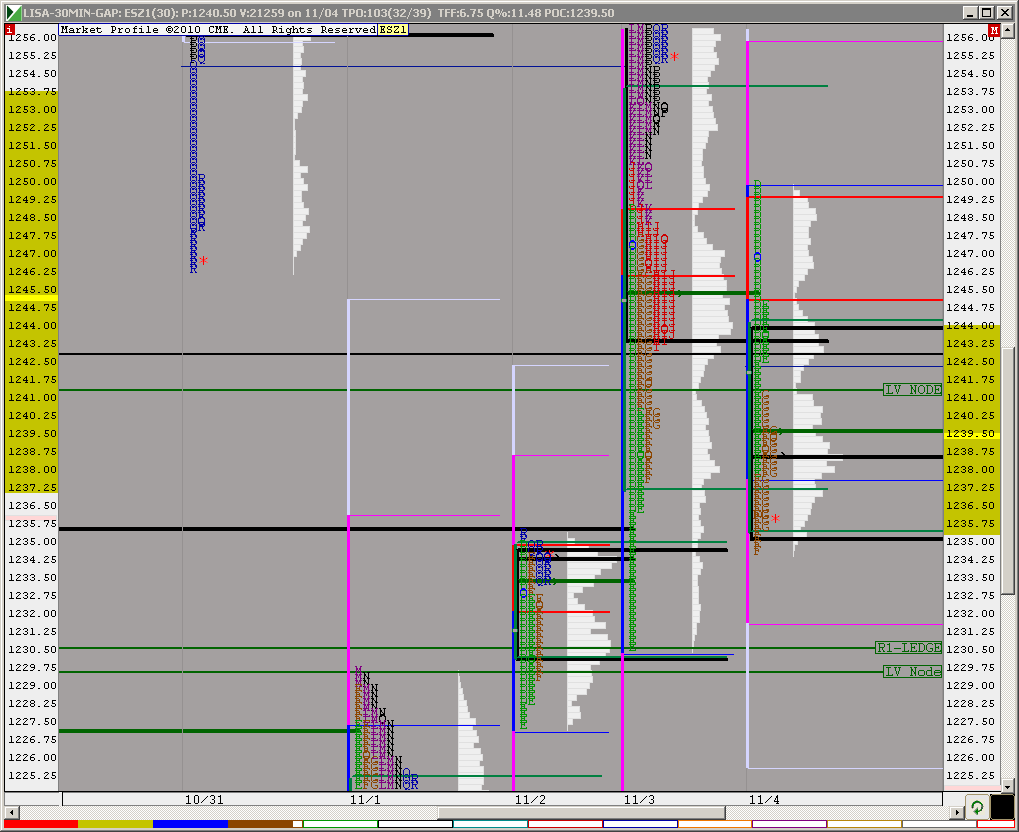
we have created a lvn today exactly where we had one yesterday, in the 41-41.5 zone lorn mentioned earlier today...for now we just have scratched back at it from below and it has acted as resistance
bruce's spirit is still around so i guess he would still have runners aiming for that area being filled in a bit
bruce's spirit is still around so i guess he would still have runners aiming for that area being filled in a bit
Shallow retracement, bias still to the downside..
5m chart looks like we will build out a developing value area down here over lunch
if you are an elliot guy this probably a 4th wave in 3 wave s should fail at 44
or above 45 a low is in at this time
or above 45 a low is in at this time
That single at 1242.25 is becoming annoying...
41.50 is good for a short but I like 45 better we are building vol above the 39 area tells me we may break the 41 are
Della,
Those are the Fisher ACD#'s as well.. I'm short@41 and will try again @45.. Will try to hold for a bigger move but the market tested down successfully several times and has formed a bottom... DX has some support which helps the cause.. My stop is @ 2.50
Those are the Fisher ACD#'s as well.. I'm short@41 and will try again @45.. Will try to hold for a bigger move but the market tested down successfully several times and has formed a bottom... DX has some support which helps the cause.. My stop is @ 2.50
Fisher ACD# what are these?
Those "past posting winning trades" you're referring to were hardly meant to show off if that's how you read into it though I don't see how... You want me to predict trades in advance before they set up but many factor cannot be predicted and most of us see the same MP levels so there is no need to repeat those.. Imagine if I called out a trade in advance and someone gets stopped out............
Emini Day Trading /
Daily Notes /
Forecast /
Economic Events /
Search /
Terms and Conditions /
Disclaimer /
Books /
Online Books /
Site Map /
Contact /
Privacy Policy /
Links /
About /
Day Trading Forum /
Investment Calculators /
Pivot Point Calculator /
Market Profile Generator /
Fibonacci Calculator /
Mailing List /
Advertise Here /
Articles /
Financial Terms /
Brokers /
Software /
Holidays /
Stock Split Calendar /
Mortgage Calculator /
Donate
Copyright © 2004-2023, MyPivots. All rights reserved.
Copyright © 2004-2023, MyPivots. All rights reserved.

