ES Friday 11-4-11
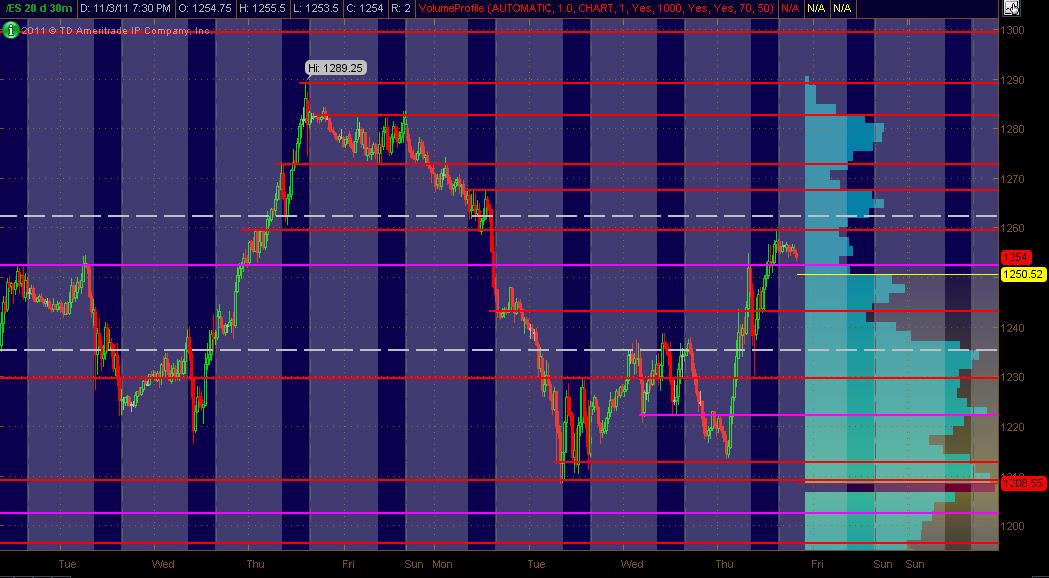
Here's my updated Monkey Map of 20-days worth of 30min chart action displaying All Trading Hours as a for what I'm looking at coming into Friday. The Red lines are potential significant PASR levels with Magenta lines being semi-significant. The White dashed lines are the Wkly Pivots. The right vertical axis shows 20 days of Volume Profile in Light Blue. The background displays RTH in Blue with "after hours" in Gray. As always, I hope this is helpful for some folks.
With the mkt being so news driven lately ... gotta take the levels/zones with a grain of salt and watch what price action is doing when it nears any ZONE.
With the mkt being so news driven lately ... gotta take the levels/zones with a grain of salt and watch what price action is doing when it nears any ZONE.
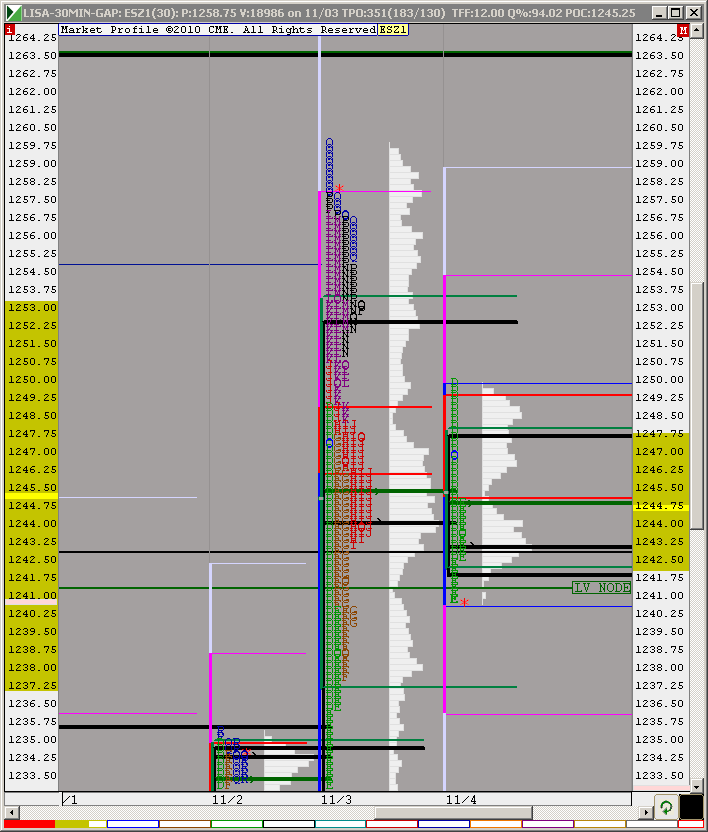
1245 is also VAH
Yesterday's TPO POC sits right at 1245.25. Midpoint from yesterday is 1245. If prices open anywhere in this vicinity they are essentially right in the middle of yesterday's value range, which means bulls and bears are agreeing on price at the moment. Give it some time to develop. Opening under that 1248 zone makes it resistance.
lorn you are so rite tick 0 to -600 witch way are we going
market seems content to sit here and fill in that low volume zone on Lorn's chart
The market is always right...I'm usually just plain wrong.
Originally posted by della
lorn you are so rite tick 0 to -600 witch way are we going
Me to lorn if i like the jets bet the other team
just kissed that 1241.25 LVN
1240 the 38% retrace
1243.50 current R level
1250 the mega fib level(62%)
1240 should be a buy signal??
or it needs to breakout of the short term range
GRPN ipo-can spike higher for the open of it
1243.50 current R level
1250 the mega fib level(62%)
1240 should be a buy signal??
or it needs to breakout of the short term range
GRPN ipo-can spike higher for the open of it
no mojo there as 1240 now R after the retrace and failure
1234 the 50% retrace level
1237 the mean between
fyi BKX s/r 40
XLF- 13.50
keep making new lows is not good
1232.50 the 50% level between 1215 and 1250
1234 the 50% retrace level
1237 the mean between
fyi BKX s/r 40
XLF- 13.50
keep making new lows is not good
1232.50 the 50% level between 1215 and 1250
Those "past posting winning trades" you're referring to were hardly meant to show off if that's how you read into it though I don't see how... You want me to predict trades in advance before they set up but many factor cannot be predicted and most of us see the same MP levels so there is no need to repeat those.. Imagine if I called out a trade in advance and someone gets stopped out............
Emini Day Trading /
Daily Notes /
Forecast /
Economic Events /
Search /
Terms and Conditions /
Disclaimer /
Books /
Online Books /
Site Map /
Contact /
Privacy Policy /
Links /
About /
Day Trading Forum /
Investment Calculators /
Pivot Point Calculator /
Market Profile Generator /
Fibonacci Calculator /
Mailing List /
Advertise Here /
Articles /
Financial Terms /
Brokers /
Software /
Holidays /
Stock Split Calendar /
Mortgage Calculator /
Donate
Copyright © 2004-2023, MyPivots. All rights reserved.
Copyright © 2004-2023, MyPivots. All rights reserved.

