ES Friday 9-30-11
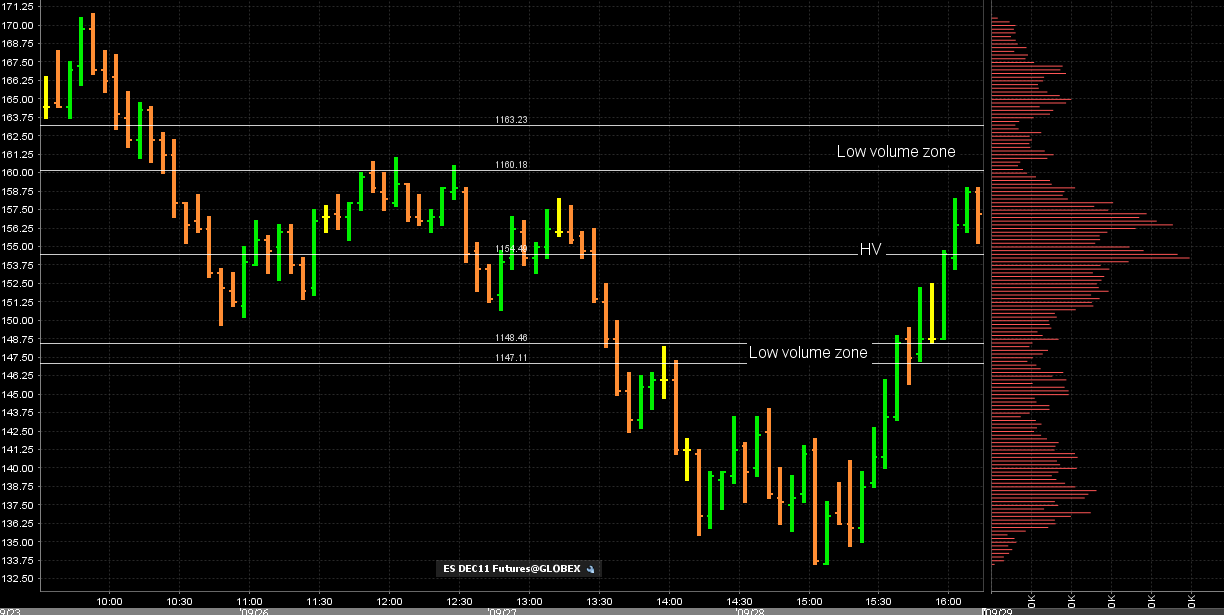
Lets at least start with the correct date.....Hopefully we can do as well with this chart as yesterday. I'm just posting it now but will elaborate more in the morning. The main bell curve has peak volume at
1154.25 . The low volume above that is a zone in the 1160.50 - 1163 and the low volume below is 1147 - 1148.50. Once again turn it on it's side if you can't see it.
We also have a secondary low volume zone at 1143 - 1144 and then another high volume spot at 1138.25. I'm not marking those on the chart right now just to keep the chart cleaner and a better visual. We'll expand on this in the morning When we see what the overnight does.
Stop is still at B.E. bc I want to give it a shot at 1145 area. will see. ES now trading 1136.75 15:06
Moving stop up to 1136.75
ES now trading 1139.50 at 15:09
ES now trading 1139.50 at 15:09
T.G.I.F.! Thank you everyone for you participation! It really helps seeing many perspectives bc at some point there's congruency between your work and mine and that = a potential trade.
I see for yourself, the same I see for me: Having an incredible, awesome weekend, best ever!!!
I see for yourself, the same I see for me: Having an incredible, awesome weekend, best ever!!!
Originally posted by sandoxe
Is a tuff trade bc is against the trend. That's why my stop is very close. Worth a shot!
ES tested the support 1133.50 and went under it, now testing it as resistance and here we go! Long at 1133.50. stop below the just made low 1131.75 at 1131.50.
will see.
ES trading 1134.25 @ 14:54 E.T.
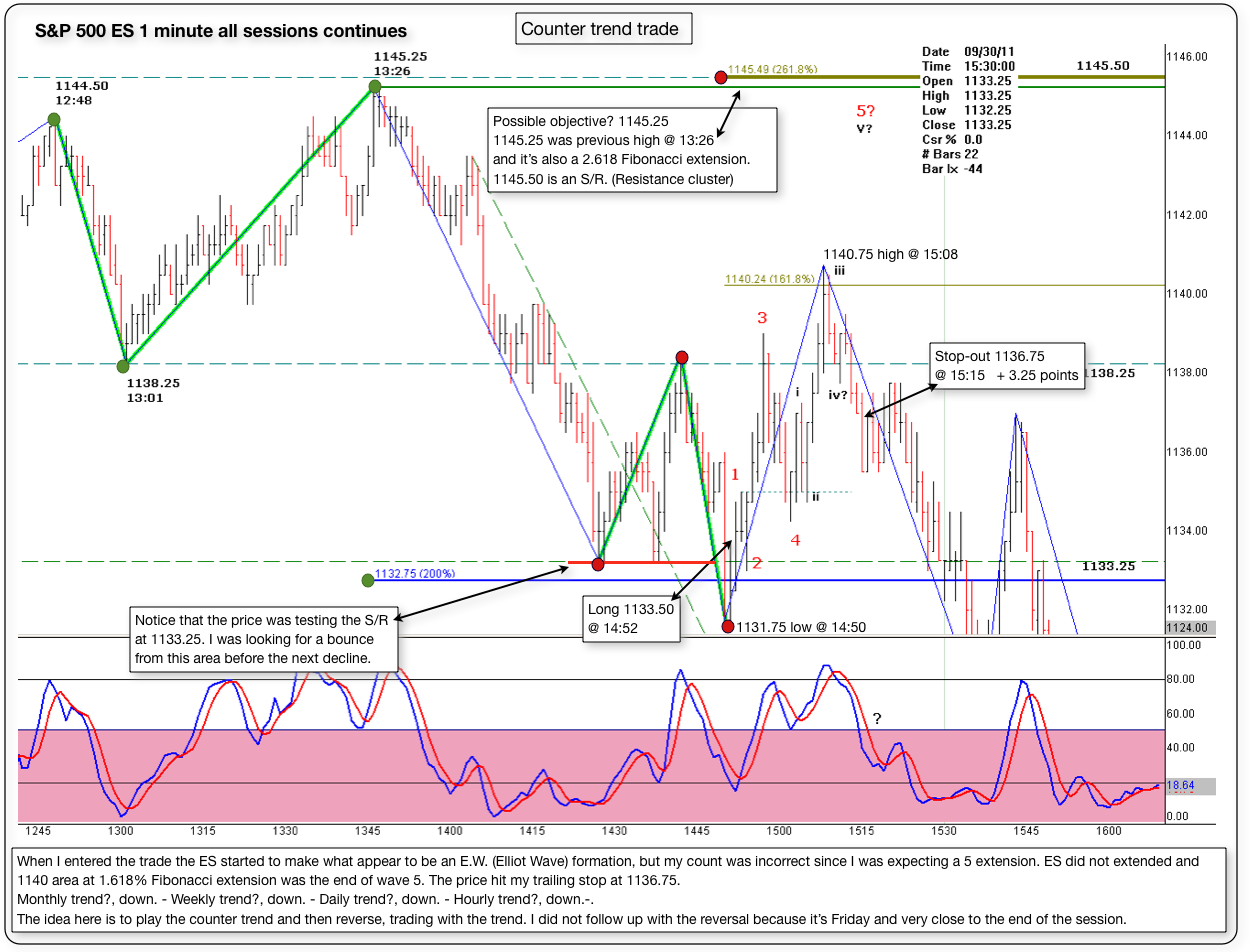
Below is a 1 minute chart with some comments about the counter trend trade posted late Friday.
When I entered the trade the ES started to make what appear to be an E.W. (Elliot Wave) formation, but my count was incorrect since I was expecting a 5 wave extension. ES did not extended and 1140 area at 1.618% Fibonacci extension was the end of wave 5. The price hit my trailing stop at 1136.75.
The idea here is to play the counter trend and then reverse, trading with the trend. I did not follow up with the reversal because it’s Friday and very close to the end of the session.
Emini Day Trading /
Daily Notes /
Forecast /
Economic Events /
Search /
Terms and Conditions /
Disclaimer /
Books /
Online Books /
Site Map /
Contact /
Privacy Policy /
Links /
About /
Day Trading Forum /
Investment Calculators /
Pivot Point Calculator /
Market Profile Generator /
Fibonacci Calculator /
Mailing List /
Advertise Here /
Articles /
Financial Terms /
Brokers /
Software /
Holidays /
Stock Split Calendar /
Mortgage Calculator /
Donate
Copyright © 2004-2023, MyPivots. All rights reserved.
Copyright © 2004-2023, MyPivots. All rights reserved.

