ES Friday 9-30-11
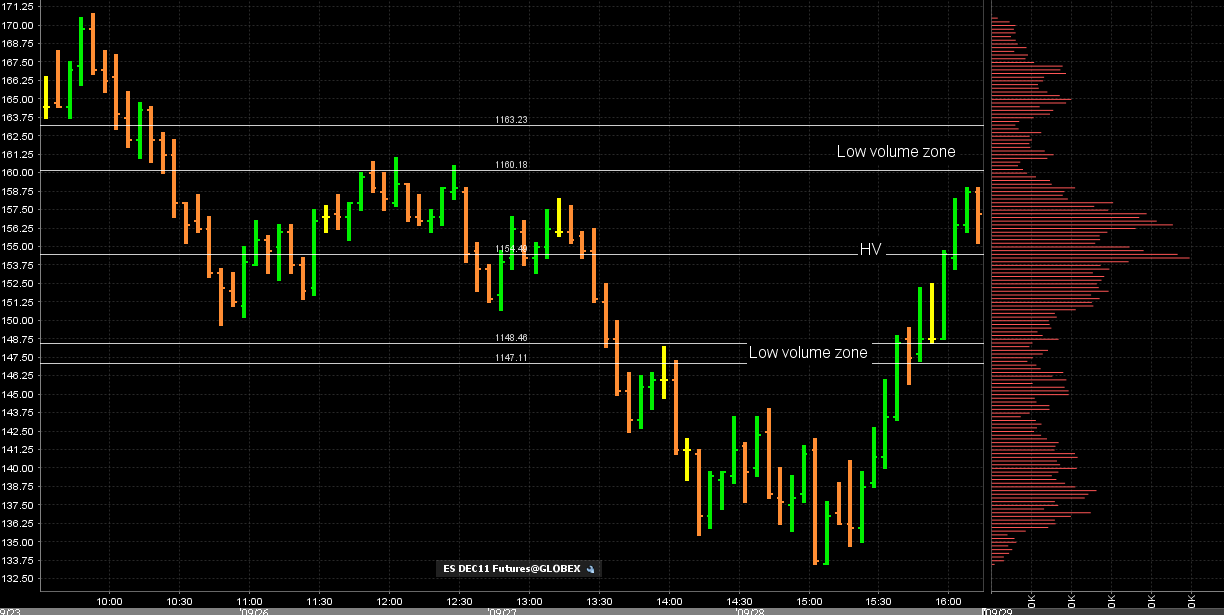
Lets at least start with the correct date.....Hopefully we can do as well with this chart as yesterday. I'm just posting it now but will elaborate more in the morning. The main bell curve has peak volume at
1154.25 . The low volume above that is a zone in the 1160.50 - 1163 and the low volume below is 1147 - 1148.50. Once again turn it on it's side if you can't see it.
We also have a secondary low volume zone at 1143 - 1144 and then another high volume spot at 1138.25. I'm not marking those on the chart right now just to keep the chart cleaner and a better visual. We'll expand on this in the morning When we see what the overnight does.
flat on all but one at 41.25...not important my trade but can everyone see that zone and why it was critical ?? Low volume here at 41.25 all the way down to 37.75...I'm trying for 38.575 on last
flat at 38.75
it dont get any better than the
correct...glad u r seeing them.....this kinda shows have a volume approach has really taken over from a TPO purist MP approach....at least for me....
Originally posted by Ross
Bruce,
Great job! Saw the LVN and assumed Delta signaled a the short play, correct?
I think that the ultimate plan for this market is to trade higher still and retest 47 - 48 again and then that 54 area..it's the testing and now holding of that 38 area that makes me say that....of course if we come back down to it then the long bet is off...
Midday update on the action.
Right side is the developing profile.
Notice the low volume rejections at both high and low of day, twice now at the highs.
Also interesting to note the LVN at 1140.50 which just so happens to be that Weekly RTH Open. Look for this to support prices if those higher numbers Bruce suggested earlier are to be seen.
ES keeps loosing ground, Down trend is intact.
Es is testing 1133.50 low. (yesterday's low) and s/r. Failure to find support will open the door for a test of 1102 in few trading sessions.
Strong supports at 1128, 1120. fib/ret and s/r.
If ES finds support at 1133.50 and moves above 1145.00, the above will be void (delay).
ES now trading 1135.70 @ 14:33
I will buy in the next bounce from 1133 area. with stop at 1131.75, will see if it give it.
ES now trading 1135.75 @ 14:46
ES now trading 1135.75 @ 14:46
Is a tuff trade bc is against the trend. That's why my stop is very close. Worth a shot!
ES tested the support 1133.50 and went under it, now testing it as resistance and here we go! Long at 1133.50. stop below the just made low 1131.75 at 1131.50.
will see.
ES trading 1134.25 @ 14:54 E.T.
ES tested the support 1133.50 and went under it, now testing it as resistance and here we go! Long at 1133.50. stop below the just made low 1131.75 at 1131.50.
will see.
ES trading 1134.25 @ 14:54 E.T.
Originally posted by sandoxe
Is a tuff trade bc is against the trend. That's why my stop is very close. Worth a shot!
ES tested the support 1133.50 and went under it, now testing it as resistance and here we go! Long at 1133.50. stop below the just made low 1131.75 at 1131.50.
will see.
ES trading 1134.25 @ 14:54 E.T.
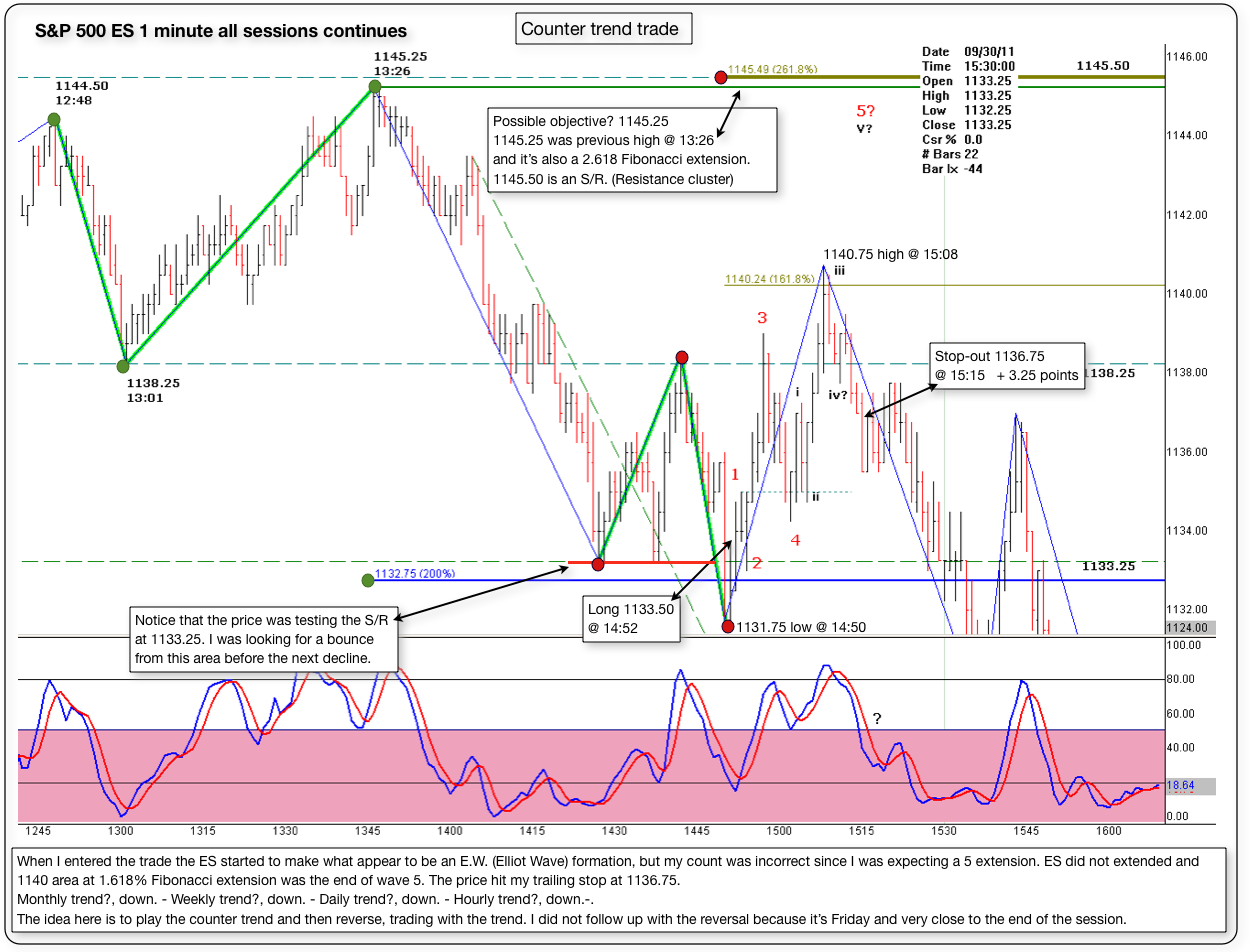
Below is a 1 minute chart with some comments about the counter trend trade posted late Friday.
When I entered the trade the ES started to make what appear to be an E.W. (Elliot Wave) formation, but my count was incorrect since I was expecting a 5 wave extension. ES did not extended and 1140 area at 1.618% Fibonacci extension was the end of wave 5. The price hit my trailing stop at 1136.75.
The idea here is to play the counter trend and then reverse, trading with the trend. I did not follow up with the reversal because it’s Friday and very close to the end of the session.
Emini Day Trading /
Daily Notes /
Forecast /
Economic Events /
Search /
Terms and Conditions /
Disclaimer /
Books /
Online Books /
Site Map /
Contact /
Privacy Policy /
Links /
About /
Day Trading Forum /
Investment Calculators /
Pivot Point Calculator /
Market Profile Generator /
Fibonacci Calculator /
Mailing List /
Advertise Here /
Articles /
Financial Terms /
Brokers /
Software /
Holidays /
Stock Split Calendar /
Mortgage Calculator /
Donate
Copyright © 2004-2023, MyPivots. All rights reserved.
Copyright © 2004-2023, MyPivots. All rights reserved.


