ES Wed 8-10-11
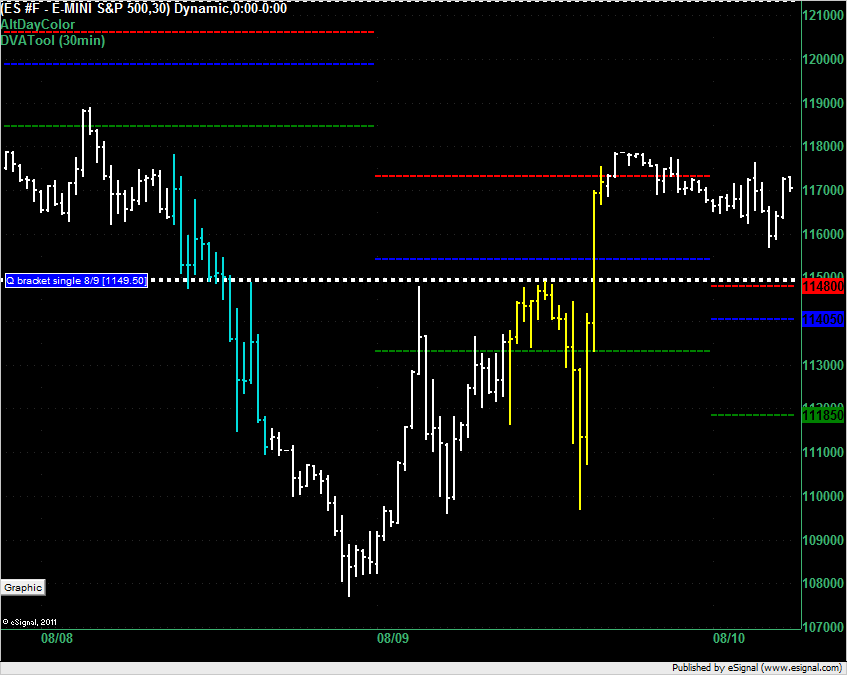
The end of day bounce yesterday (Tuesday) left a single print at 1149.50 and the day's trading created a value area bounded by a VAH of 1148 even, just 2 ticks below the single print. The chart below shows Monday's trading session as cyan (blue) bars and Tuesday's trading session as yellow bars. The white bars show the overnight action. You can see that on Monday there was support (and then resistance) at around 1149 and then the overnight session used that as resistance and then most of Tuesday's session used that as resistance until it was broken at the end of the day. Now with the VAH and single print marking the spot and the market looking like it is set to open above this area my call is a long at 1148 or 1148.50.
if you have Bloomberg terminal, by all means...lol
god i had low VOL today at 35.25 it held it for 3 mins
Emini Day Trading /
Daily Notes /
Forecast /
Economic Events /
Search /
Terms and Conditions /
Disclaimer /
Books /
Online Books /
Site Map /
Contact /
Privacy Policy /
Links /
About /
Day Trading Forum /
Investment Calculators /
Pivot Point Calculator /
Market Profile Generator /
Fibonacci Calculator /
Mailing List /
Advertise Here /
Articles /
Financial Terms /
Brokers /
Software /
Holidays /
Stock Split Calendar /
Mortgage Calculator /
Donate
Copyright © 2004-2023, MyPivots. All rights reserved.
Copyright © 2004-2023, MyPivots. All rights reserved.
