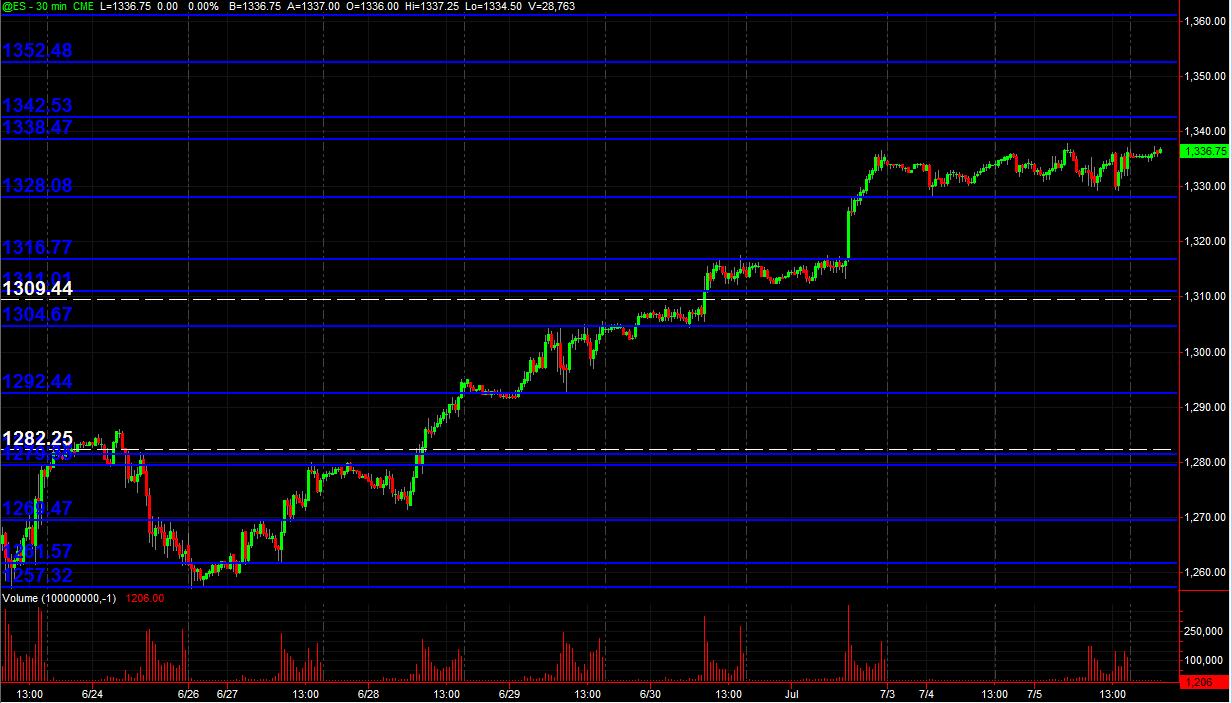
ES Trading for 7-6-11
Just posting a 30min chart (all trading hours) with Blue lines as potential significant PASR zones and White dashed lines are Weekly Pivots. It's a map for coming into Wednesday's trading and beyond. After last week's 5 up-trending days, price has been consolidating near the high of that run in the 1328-1338 range of 10 points. Here's the "picture"
Hope some folks find this useful!
Hope some folks find this useful!
Nick...u don't need an MP chart to see single prints...just look where you have no price bar overlap on 30 minute time frame.....just like air pockets but only on the 30 minute
due to some family reponsibilities I'm leaving this one go with a target at 30.25.......but if 35.50 prints again then I am out on this last runner...just don't like this time of day anuway but the risk is worth the reward to me...good luck all if u r trading the rest of today....c ya...risky spot these air pockets
Bruce, what is your reason for 30.25 target, please?
Lisa, that was simply making my risk equal to reward at that point when price was near 32.75....
Emini Day Trading /
Daily Notes /
Forecast /
Economic Events /
Search /
Terms and Conditions /
Disclaimer /
Books /
Online Books /
Site Map /
Contact /
Privacy Policy /
Links /
About /
Day Trading Forum /
Investment Calculators /
Pivot Point Calculator /
Market Profile Generator /
Fibonacci Calculator /
Mailing List /
Advertise Here /
Articles /
Financial Terms /
Brokers /
Software /
Holidays /
Stock Split Calendar /
Mortgage Calculator /
Donate
Copyright © 2004-2023, MyPivots. All rights reserved.
Copyright © 2004-2023, MyPivots. All rights reserved.
