ES Trading for 7-6-11
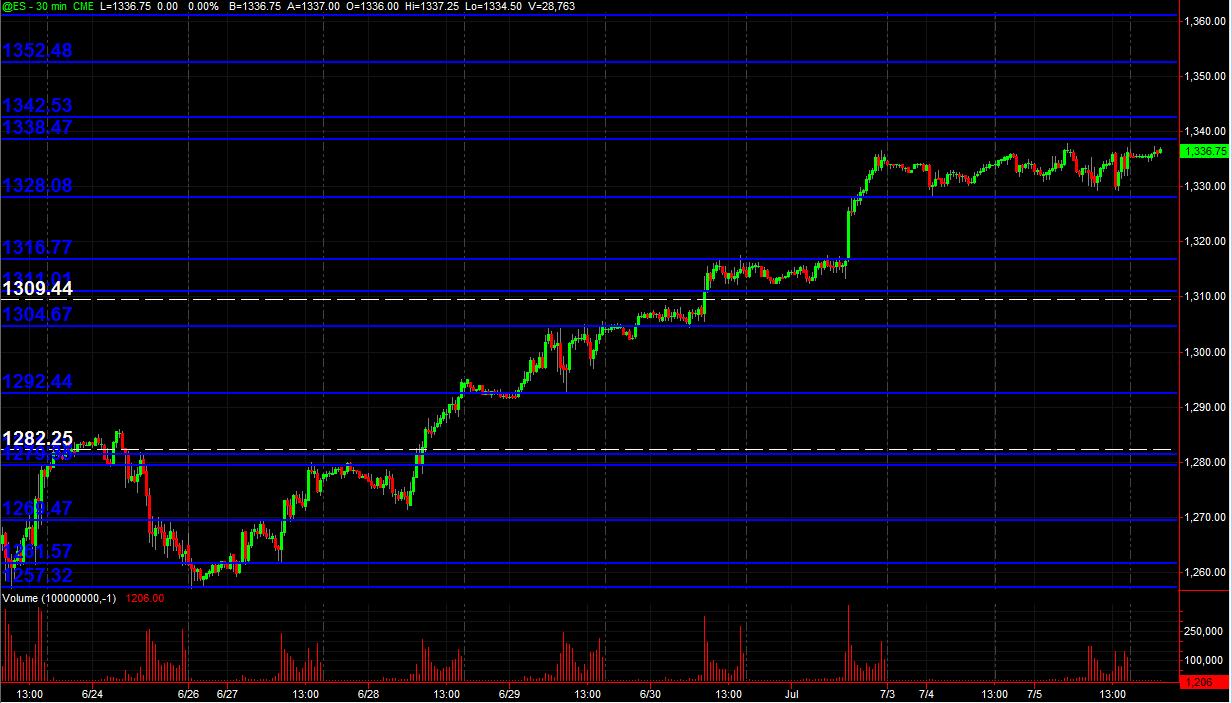
Just posting a 30min chart (all trading hours) with Blue lines as potential significant PASR zones and White dashed lines are Weekly Pivots. It's a map for coming into Wednesday's trading and beyond. After last week's 5 up-trending days, price has been consolidating near the high of that run in the 1328-1338 range of 10 points. Here's the "picture"
Hope some folks find this useful!
Hope some folks find this useful!
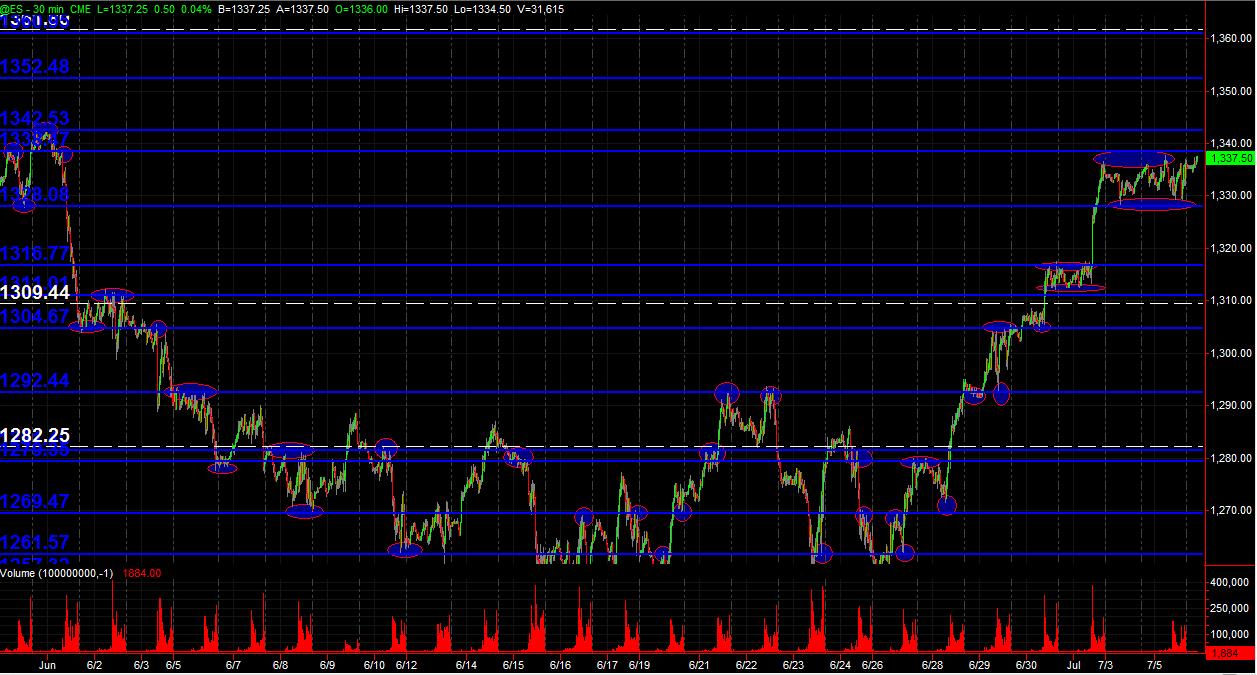
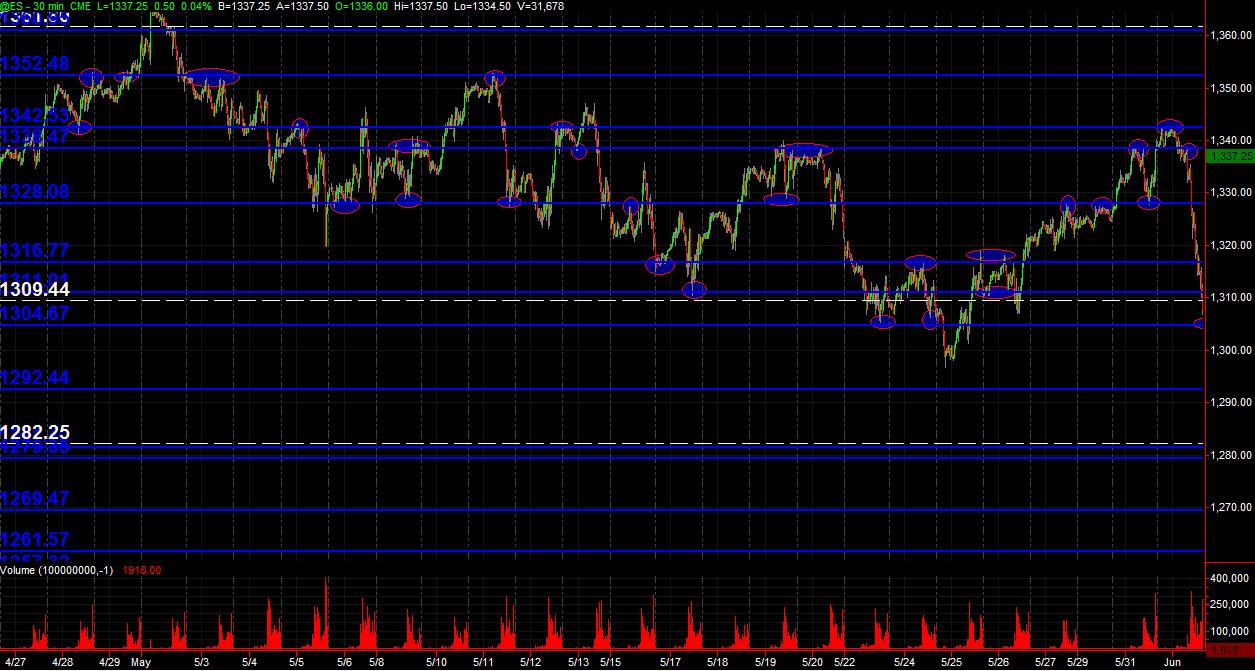
Here's what I was seeing to draw in the PASR levels in Blue. I've drawn elipses around certain price areas in the past. Maybe this adds some extra insight into the ES "map." The first chart is the most recent 30min, with the next chart going back further in time (with a tad of overlap with the first one). Hopefully these can be menatlly visualized as end-to-end. Simply adding the analysis behind the posting of just a map of PASR blue lines. Like I've said before, it ain't rocket science ... but there's a bit of personal discretion and "art" to it mapping the zones.
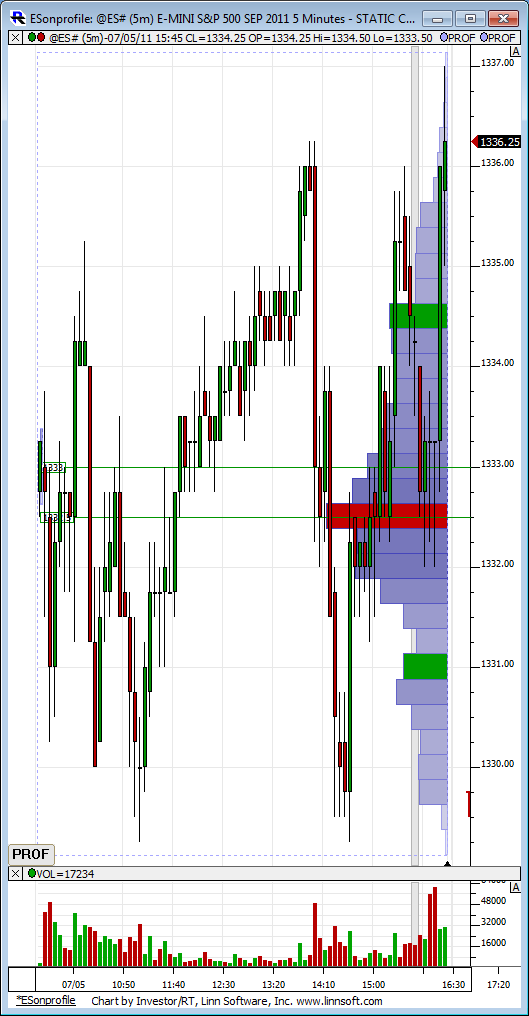
Yesterday's Vprofile. You can see the bellcurve. Something to note is prices finished near the highs rather then in the middle. According to Dalton on a neutral day like yesterday this might suggest there is long inventory which now has bad trade location (entry level), and could easily get squeezed into covering. Seems like that might have already happened here in the O/N.
I agree Lorn..they stole that 40 - 42 zone in the Overnight...that's cheating ...they will pay !!!!! At least we should get some better volume today....
Using 28.50 - 30 as support and initially that 34 area as resistence
Using 28.50 - 30 as support and initially that 34 area as resistence
O/N POC: 1335.75
O/N VPOC: 1330.00
I'm always on my toes when those two numbers are spread.
5 Day average range: 17.25
O/N Range: 12.50
Yesterday we had range contraction. Lets see if today gets back to its average.
O/N VPOC: 1330.00
I'm always on my toes when those two numbers are spread.
5 Day average range: 17.25
O/N Range: 12.50
Yesterday we had range contraction. Lets see if today gets back to its average.
report in 2 min...
I really want them to get back into the Opening range....whenever we see trade into a low volume area we really want to see it move away from our area quickly...in this case to go up and fast...
spending time in a low volume area implies that they are now accepting price in there instead of buyers defending in this example from today...so this needs to get a move on or my crystal ball is forcasting trade down into the 23 zone
spending time in a low volume area implies that they are now accepting price in there instead of buyers defending in this example from today...so this needs to get a move on or my crystal ball is forcasting trade down into the 23 zone
definitely looking weak here
wow..summer has come quick..they can't even push and hit a minus 4 number
Lisa, that was simply making my risk equal to reward at that point when price was near 32.75....
Emini Day Trading /
Daily Notes /
Forecast /
Economic Events /
Search /
Terms and Conditions /
Disclaimer /
Books /
Online Books /
Site Map /
Contact /
Privacy Policy /
Links /
About /
Day Trading Forum /
Investment Calculators /
Pivot Point Calculator /
Market Profile Generator /
Fibonacci Calculator /
Mailing List /
Advertise Here /
Articles /
Financial Terms /
Brokers /
Software /
Holidays /
Stock Split Calendar /
Mortgage Calculator /
Donate
Copyright © 2004-2023, MyPivots. All rights reserved.
Copyright © 2004-2023, MyPivots. All rights reserved.
