ES 6-28-2011
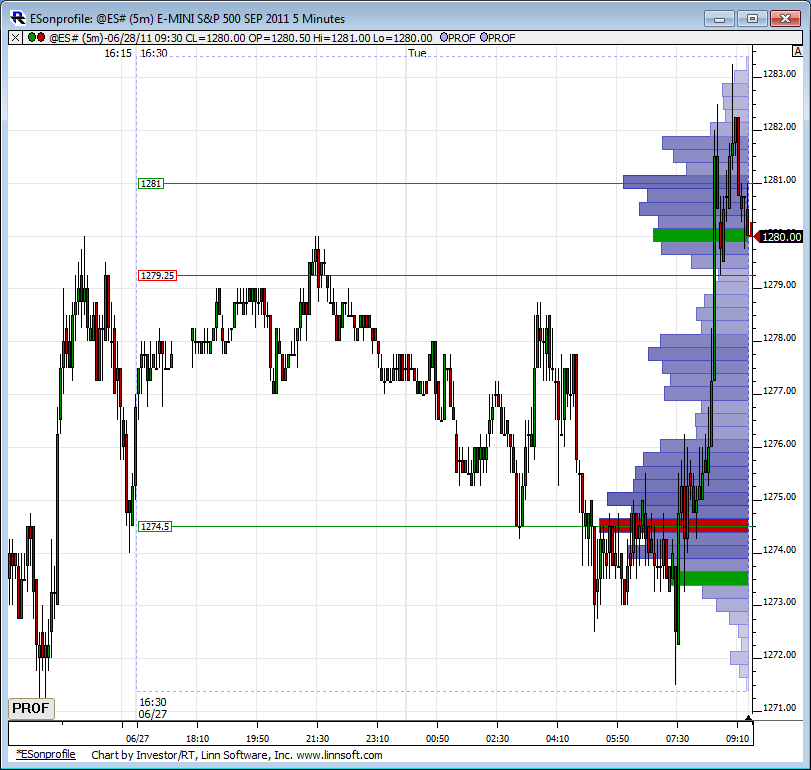
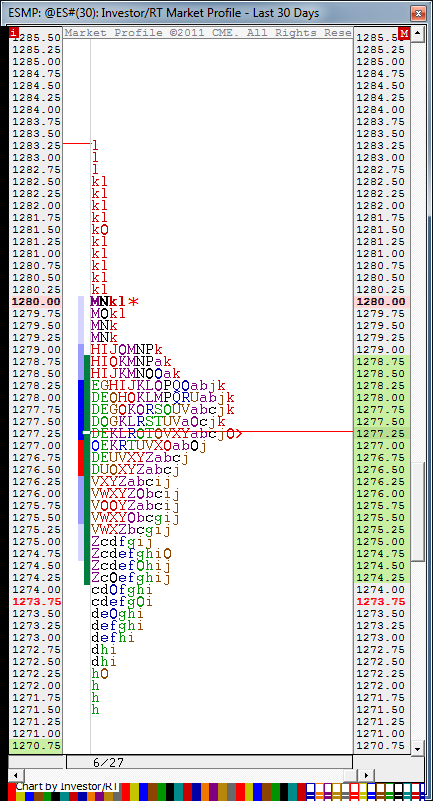
Two charts. O/N Volume Profile and O/N TPO profile. Whats interesting is the two are pretty much opposite looking. Volume entered the market at the lows of the O/N and quickly drove prices north.
Also, price is currently sitting on YD RTH high of 1280. If opening here, we will be above YD value and above YD range, per Dalton, range potential is unlimited in either direction.
Also, price is currently sitting on YD RTH high of 1280. If opening here, we will be above YD value and above YD range, per Dalton, range potential is unlimited in either direction.
1286 also current hourly s/r level
nice info all!
nice info all!
what fib levels are you referring to David ?
Originally posted by DavidS
1286 the mark for me
previous high 6/24 and 2 different fib levels
previous 1286 high is the 100% level
from low to yesterdays high, then down to 1271.50 O/N low gives 1286 area as 61.8% extension up of that move
from low to yesterdays high, then down to 1271.50 O/N low gives 1286 area as 61.8% extension up of that move
There could be a pretty significant MACD divergence on the hourly chart going into the 1286-ish area using o/n data
thanks for the explanation
i am looking at the 93-94 level to sell again, a couple of fib projections from different time frames coming in that area, the recent high of 93.75 (6/22). R2 also in that area
might not be around if taht happens late in the day, so good luck all
i am looking at the 93-94 level to sell again, a couple of fib projections from different time frames coming in that area, the recent high of 93.75 (6/22). R2 also in that area
might not be around if taht happens late in the day, so good luck all
Extension levels from O/N low;
50%=1283
38.2%=1280.25
23.6%=1277
upward of 1286 61.8%
76.4%=1289
100%=1294.5
all approximate/rounded numbers
50%=1283
38.2%=1280.25
23.6%=1277
upward of 1286 61.8%
76.4%=1289
100%=1294.5
all approximate/rounded numbers
Just another word of caution and I'll shutup.
1287 the 68% level on the extensions and all that's required for a C wave in a correction.
1287 the 68% level on the extensions and all that's required for a C wave in a correction.
Interesting to note in regards to those Monday range numbers there is a NPOC at 1291.00 and 1298.00
Originally posted by PAUL9
618 and full extension of Monday's range
UP .618 = 1291.25, if it prints before Monday's Close, 8 in 10 odds that full extension of Monday's range will unfold, meaning a print of 1298.25
IMHO a 'TELL' of bullish potential is: if Price moves above the H of the previous day and then that H of the previous day acts like support. H yesterday was 1280.00
If H yesterday breaks, I put first target at previous RTH swing L, for yesterday that was 76 to 74 area.
just sold the 90 minute high...targeting single prints in 84 area...nice $tick divergence...we'll see
End of quarter stuff..buying only
Emini Day Trading /
Daily Notes /
Forecast /
Economic Events /
Search /
Terms and Conditions /
Disclaimer /
Books /
Online Books /
Site Map /
Contact /
Privacy Policy /
Links /
About /
Day Trading Forum /
Investment Calculators /
Pivot Point Calculator /
Market Profile Generator /
Fibonacci Calculator /
Mailing List /
Advertise Here /
Articles /
Financial Terms /
Brokers /
Software /
Holidays /
Stock Split Calendar /
Mortgage Calculator /
Donate
Copyright © 2004-2023, MyPivots. All rights reserved.
Copyright © 2004-2023, MyPivots. All rights reserved.


