ES 6-28-2011
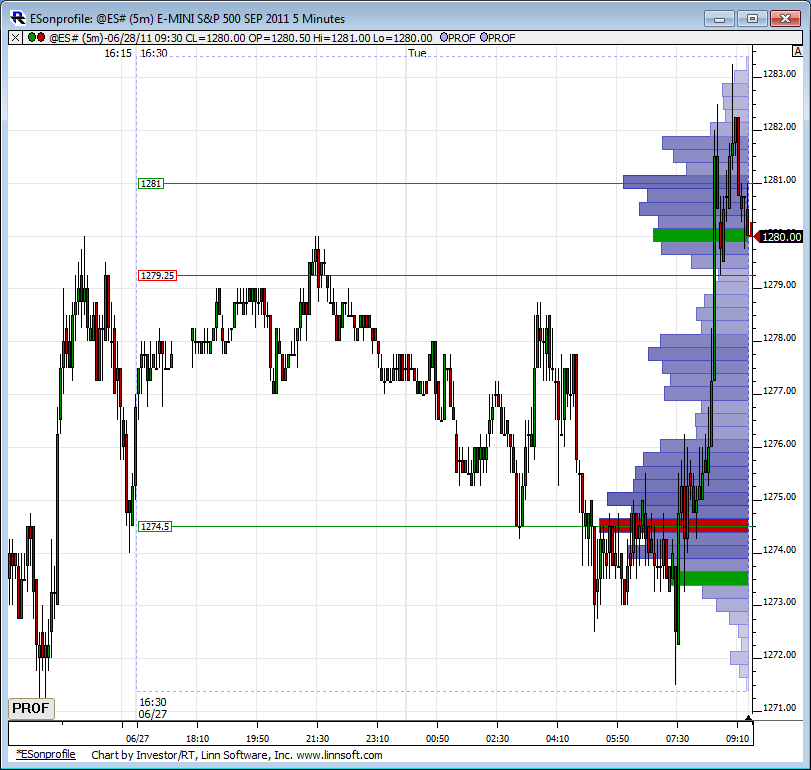
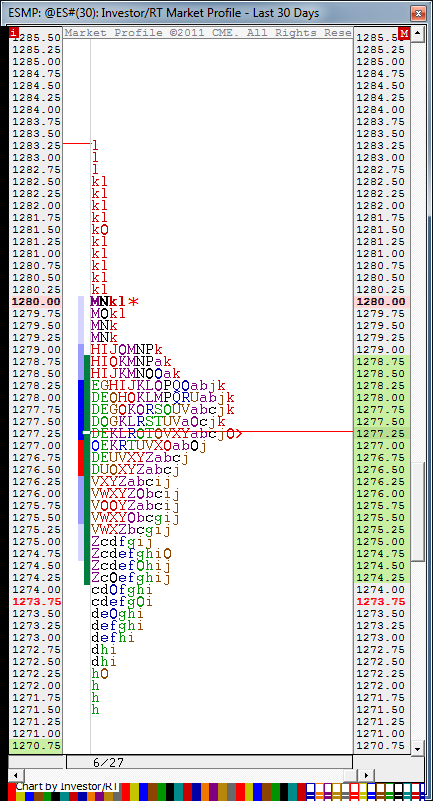
Two charts. O/N Volume Profile and O/N TPO profile. Whats interesting is the two are pretty much opposite looking. Volume entered the market at the lows of the O/N and quickly drove prices north.
Also, price is currently sitting on YD RTH high of 1280. If opening here, we will be above YD value and above YD range, per Dalton, range potential is unlimited in either direction.
Also, price is currently sitting on YD RTH high of 1280. If opening here, we will be above YD value and above YD range, per Dalton, range potential is unlimited in either direction.
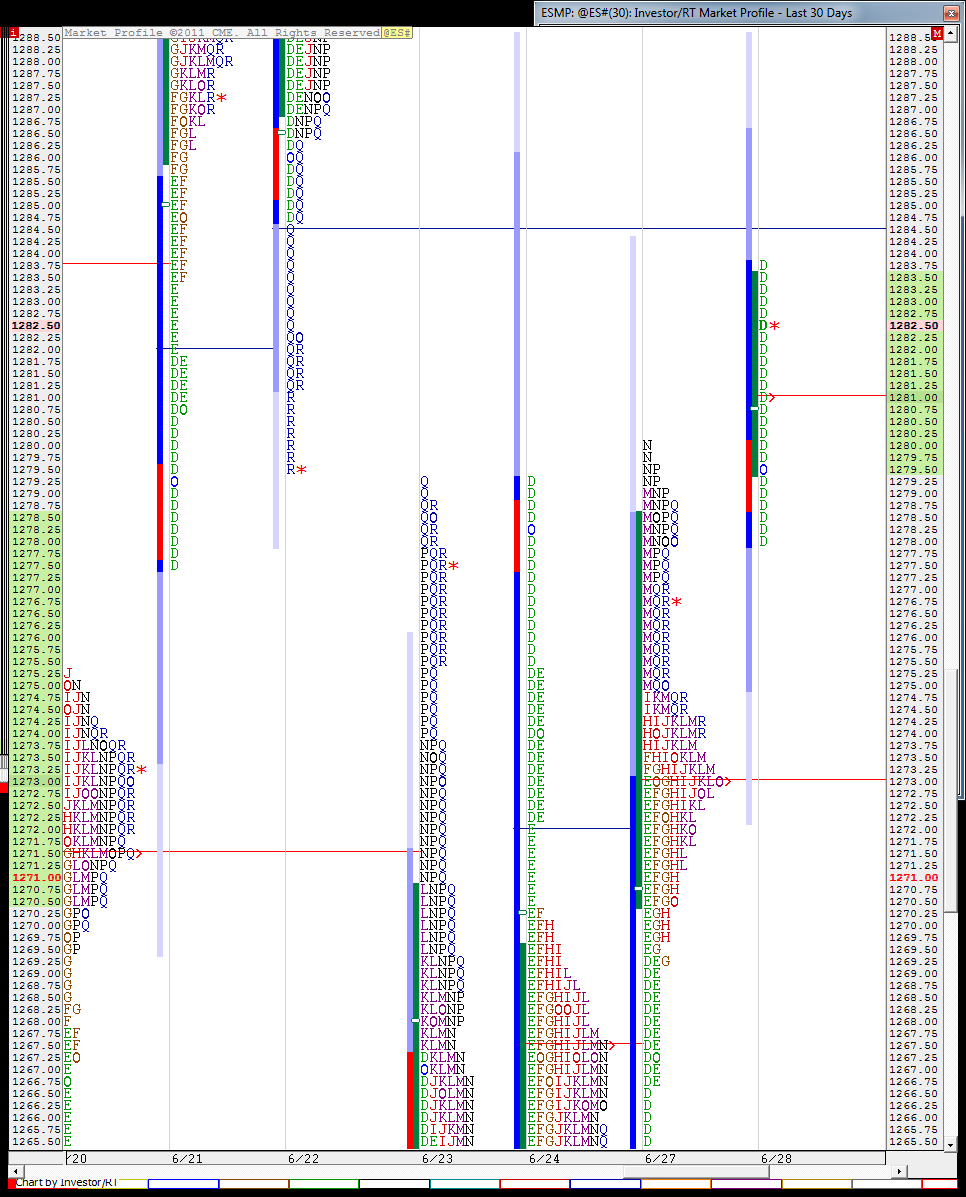
Single print at 1284.50
LORN,
please help me out here, do you have date of 84.50 single print?
(and I assume for the TPO you are using 30minute windows, correct?)
please help me out here, do you have date of 84.50 single print?
(and I assume for the TPO you are using 30minute windows, correct?)
618 and full extension of Monday's range
UP .618 = 1291.25, if it prints before Monday's Close, 8 in 10 odds that full extension of Monday's range will unfold, meaning a print of 1298.25
IMHO a 'TELL' of bullish potential is: if Price moves above the H of the previous day and then that H of the previous day acts like support. H yesterday was 1280.00
If H yesterday breaks, I put first target at previous RTH swing L, for yesterday that was 76 to 74 area.
thanks, Lorn.
can't argue with a bull trend.
can't argue with a bull trend.
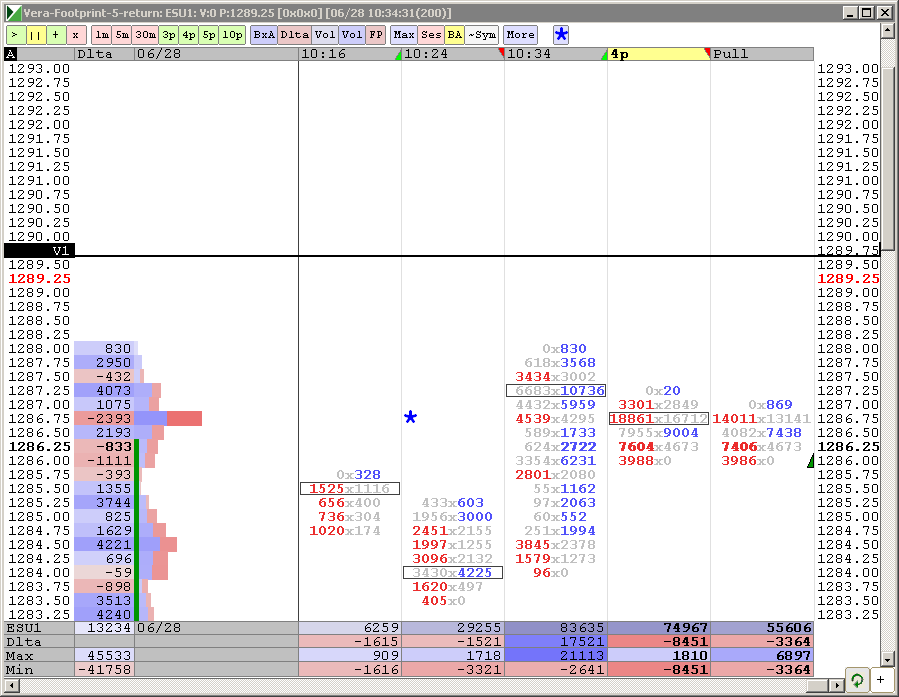
watching 87.25
because on a 15minuite chart, 87.25 is the open of the last 15 minutes of 6/22/11 (from 4:oo to 4:15pm)
because on a 15minuite chart, 87.25 is the open of the last 15 minutes of 6/22/11 (from 4:oo to 4:15pm)
I need to make a minor correction to the last description I gave of 87.25, that was the "breaker bar" open, but it was completed as of 4:00pm on 6/22/11
my definition of a breaker bar is after a period of sideways price action, Breaker Bar is the bar that starts inbside the consolidation zone but then... Breaks out and closes outside of consolidation zone.
the longer the timeframe of the bar, the longer time you have to give price to test the open of that bar.
viewing 5 minute bars, many times when there is a headline related sell-off (on an 8:30 release) market can be trading sideways into the headline, become disappointed, drop like a rock and then once a higher Low is established, can target Open of breaker bar.
1286 the mark for me
previous high 6/24 and 2 different fib levels
previous high 6/24 and 2 different fib levels
End of quarter stuff..buying only
Emini Day Trading /
Daily Notes /
Forecast /
Economic Events /
Search /
Terms and Conditions /
Disclaimer /
Books /
Online Books /
Site Map /
Contact /
Privacy Policy /
Links /
About /
Day Trading Forum /
Investment Calculators /
Pivot Point Calculator /
Market Profile Generator /
Fibonacci Calculator /
Mailing List /
Advertise Here /
Articles /
Financial Terms /
Brokers /
Software /
Holidays /
Stock Split Calendar /
Mortgage Calculator /
Donate
Copyright © 2004-2023, MyPivots. All rights reserved.
Copyright © 2004-2023, MyPivots. All rights reserved.


