ES trading 4-6-11
Here is that video from last Friday that I re-recorded....Hopefully my new microphone helps with the sound. I also recorded one from today's trade basically showing the same concepts of evolving volume and how it becomes attractors.
and here is today:
and here is today:
Yes, Lorn, thank you, it does answer my question.
It was a curiosity to me because even though I am not running software like yours, TS has what they call an activity bar. produces virtually the same volume profile as you post on virtually everyday, but not last night, Today the HVN on that TS (just for O/N price traffic) came in at 1329-1328.25 area.
BTW TS has a pretty good article about times of day and most useful measures.
https://www.tradestation.com/support/tslabs/default.aspx?report=21
worth reading the PART1 (referrenced in the report), Part1 divides the RTH day into 3 130minute segments and then graphically shows what most of us already know, first 130minutes most active.
Nice article, similar to how I already trade, but it's nice to see more thorough graphs and research as confirmation.
Originally posted by PAUL9
Yes, Lorn, thank you, it does answer my question.
It was a curiosity to me because even though I am not running software like yours, TS has what they call an activity bar. produces virtually the same volume profile as you post on virtually everyday, but not last night, Today the HVN on that TS (just for O/N price traffic) came in at 1329-1328.25 area.
BTW TS has a pretty good article about times of day and most useful measures.
https://www.tradestation.com/support/tslabs/default.aspx?report=21
worth reading the PART1 (referrenced in the report), Part1 divides the RTH day into 3 130minute segments and then graphically shows what most of us already know, first 130minutes most active.
Interesting article Paul.
I find the results on mean reversion fascinating...
I find the results on mean reversion fascinating...
In evaluating the mean reversion results, we can see that mean reversion signals improve in the exact opposite fashion of momentum signals. The mean reversion performs the worst from 9:30 to 11:40, improving as the day progresses.
Originally posted by PAUL9
Yes, Lorn, thank you, it does answer my question.
It was a curiosity to me because even though I am not running software like yours, TS has what they call an activity bar. produces virtually the same volume profile as you post on virtually everyday, but not last night, Today the HVN on that TS (just for O/N price traffic) came in at 1329-1328.25 area.
BTW TS has a pretty good article about times of day and most useful measures.
https://www.tradestation.com/support/tslabs/default.aspx?report=21
worth reading the PART1 (referrenced in the report), Part1 divides the RTH day into 3 130minute segments and then graphically shows what most of us already know, first 130minutes most active.
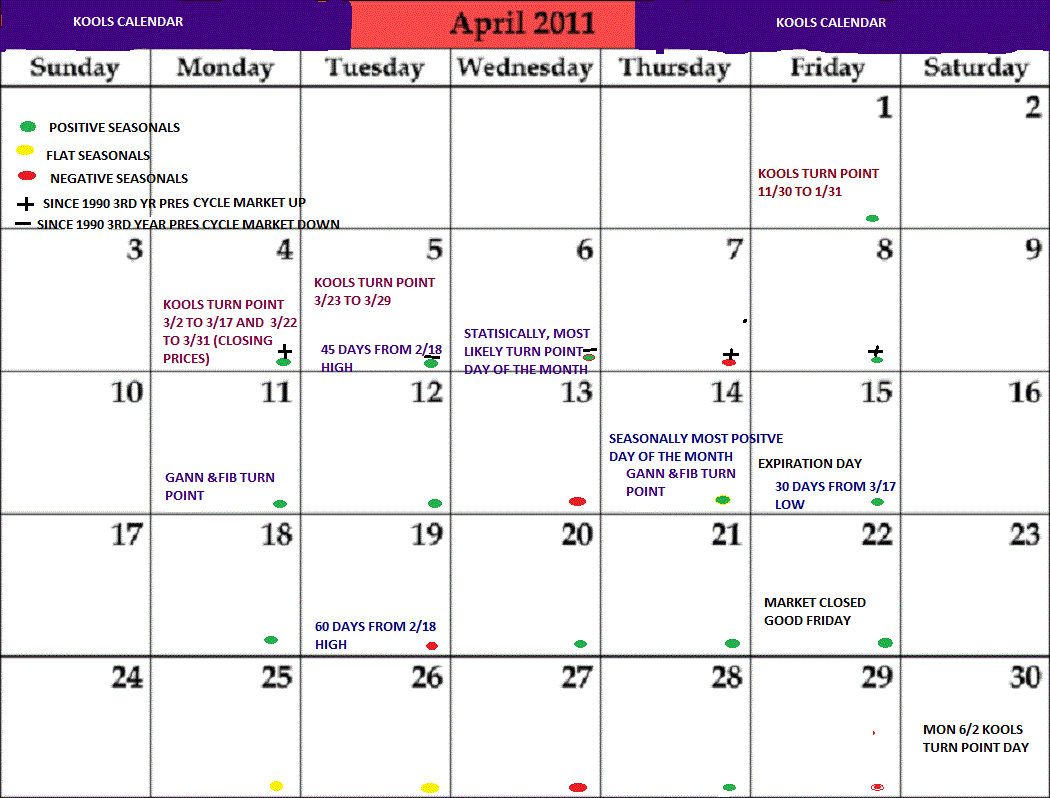
FROM SENTIMENTRADER:"One of the possible props underneath the market the past few days has been seasonality. The first four trading days of April have been quite positive, as we discussed coming into the month. But that runs out today, and then for the next week SPY has been positive only 37% of the time. QQQ (Nasdaq 100) was up 33% of the time."....AND HERE ARE THE STATS REGARDING THE RECENT RISE IN OPTIMISM...
Market is extremely slow
I couldn't tell, I was watching paint dry...I mean the market =)
Originally posted by palmer
Market is extremely slow
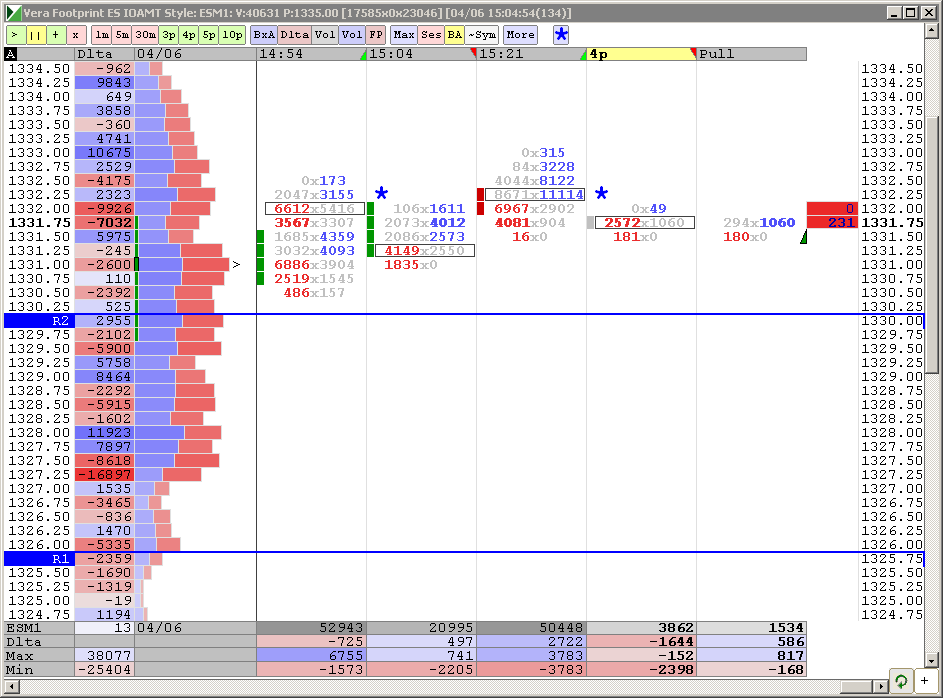
that seems a bit sloppy... that whole in the profile at 30.75....sure seems like they want to round out this distribution a bit more....If only it wasn't so late in the day I'd be taking some stabs at shorts once more ..this 32.25 is trying for peak volume now
THANK YOU VERY MUCH FOR THE REPLY, YES IT WORKS WITH CHROME
Emini Day Trading /
Daily Notes /
Forecast /
Economic Events /
Search /
Terms and Conditions /
Disclaimer /
Books /
Online Books /
Site Map /
Contact /
Privacy Policy /
Links /
About /
Day Trading Forum /
Investment Calculators /
Pivot Point Calculator /
Market Profile Generator /
Fibonacci Calculator /
Mailing List /
Advertise Here /
Articles /
Financial Terms /
Brokers /
Software /
Holidays /
Stock Split Calendar /
Mortgage Calculator /
Donate
Copyright © 2004-2023, MyPivots. All rights reserved.
Copyright © 2004-2023, MyPivots. All rights reserved.


