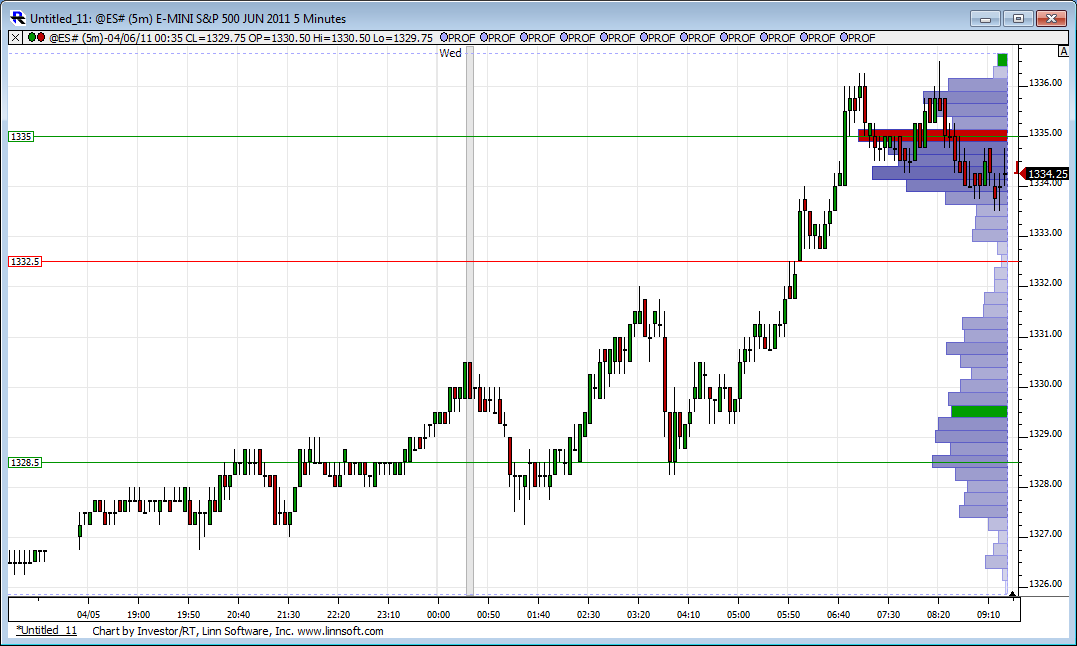
ES trading 4-6-11
Here is that video from last Friday that I re-recorded....Hopefully my new microphone helps with the sound. I also recorded one from today's trade basically showing the same concepts of evolving volume and how it becomes attractors.
and here is today:
and here is today:
thanks for the video, Bruce.
A picture truly is worth a thousand words.
A picture truly is worth a thousand words.
thx as well bruce for video nice to see what you looking at......hopefully i'll be able to contribute.....
Vids are fantastic stuff... thanks very much
Key area for me today will be the O/N high up to the contract high so
1336.00 - 1337.75
and then we have current O/N midpoint and volume that came in at
1330.50 - 1331.50 ******this includes the day session Volume from the video
That will be crucial line for bulls to hold up any rally attempt today..
Below there is 1327.75.....volume and 4pm close in there..
critical that internals improve on any up move as they have been diverging to the downside......
No reports at 10 a.m. so I still favor shorts
and thanks for the "thank you's" ...it's nice to know they are appreciated
trying shorts up near 35.50.....On high may still need to run out...so hopefully not too early...other short area for me won't be until 37.50 area
oil at 109 we should be good for shorts right now
Lorn,
please excuse if this seems elementary question, but chart you posted with histogram on right is price frequency (Market Profile) only, correct?
please excuse if this seems elementary question, but chart you posted with histogram on right is price frequency (Market Profile) only, correct?
Volume profile for the O/N session overlaid on a 5-min chart.
Does that answer your question?
Does that answer your question?
Originally posted by PAUL9
Lorn,
please excuse if this seems elementary question, but chart you posted with histogram on right is price frequency (Market Profile) only, correct?
THANK YOU VERY MUCH FOR THE REPLY, YES IT WORKS WITH CHROME
Emini Day Trading /
Daily Notes /
Forecast /
Economic Events /
Search /
Terms and Conditions /
Disclaimer /
Books /
Online Books /
Site Map /
Contact /
Privacy Policy /
Links /
About /
Day Trading Forum /
Investment Calculators /
Pivot Point Calculator /
Market Profile Generator /
Fibonacci Calculator /
Mailing List /
Advertise Here /
Articles /
Financial Terms /
Brokers /
Software /
Holidays /
Stock Split Calendar /
Mortgage Calculator /
Donate
Copyright © 2004-2023, MyPivots. All rights reserved.
Copyright © 2004-2023, MyPivots. All rights reserved.
