ES numbers for 3-29-11
Numbers generated from todays trade based on volume
1312.50 volume spikes ****
1310.25 Volume spikes ****
1307 Volume spikes
Old ones you should have on your radar from previous days:
1300 - 1301
1295.50
1291 - minor
1287.50 ****** major number
1282.25 ******
1312.50 volume spikes ****
1310.25 Volume spikes ****
1307 Volume spikes
Old ones you should have on your radar from previous days:
1300 - 1301
1295.50
1291 - minor
1287.50 ****** major number
1282.25 ******
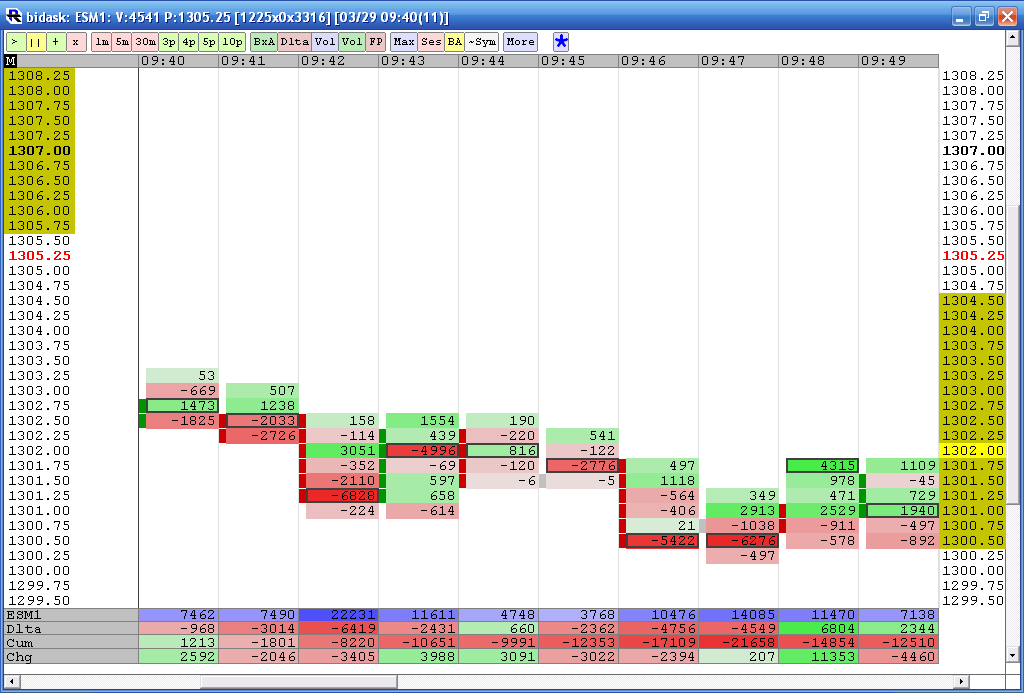
I'm gonna make this quick today......I was buying into the 1300 area as it was a key zone...( 1300- 1301)..Now lorn made an excellent point yesterday about volume and this bid/ask stuff and that is that these footprints are only showing the aggressive buyers or sellers...not TOTAL volume....so Today I watched the 9:42 one minute bar...it had the biggest volume and it was made up of sellers...I watched this on the bar chart...then flipped to delta to see what happened
Look at my chart below at 9:42... it had the biggest area shaded at -6828 sellers at a price of 1301.25.....now this is critical....look what happens at the 9:46 and 9:47 bars....we make new lows on lower volume and higher delta compared to the 9:42 bar...so price is probing lower on less volume and HIGHER net delta....someone is trying to get long....and this is a key zone...so I'm a buyer anyway...so this helped me initiate...
Pt's did some videos which Lorn linked up yesterday....which explains this much better than my post here...I'm just showing how I incorporated the key ideas of having a key area and looking at the High volume bars...in conjunction with the delta ...
I'm appreciative of all the help you folks are giving me and may not have thanked you yesterday......so THANKS
sellers are trying to step in again up at 1307.50 for the 1305 retest....I hope...
error on my part...the key price would be 1305.75 for a retest...ok...nuff said...
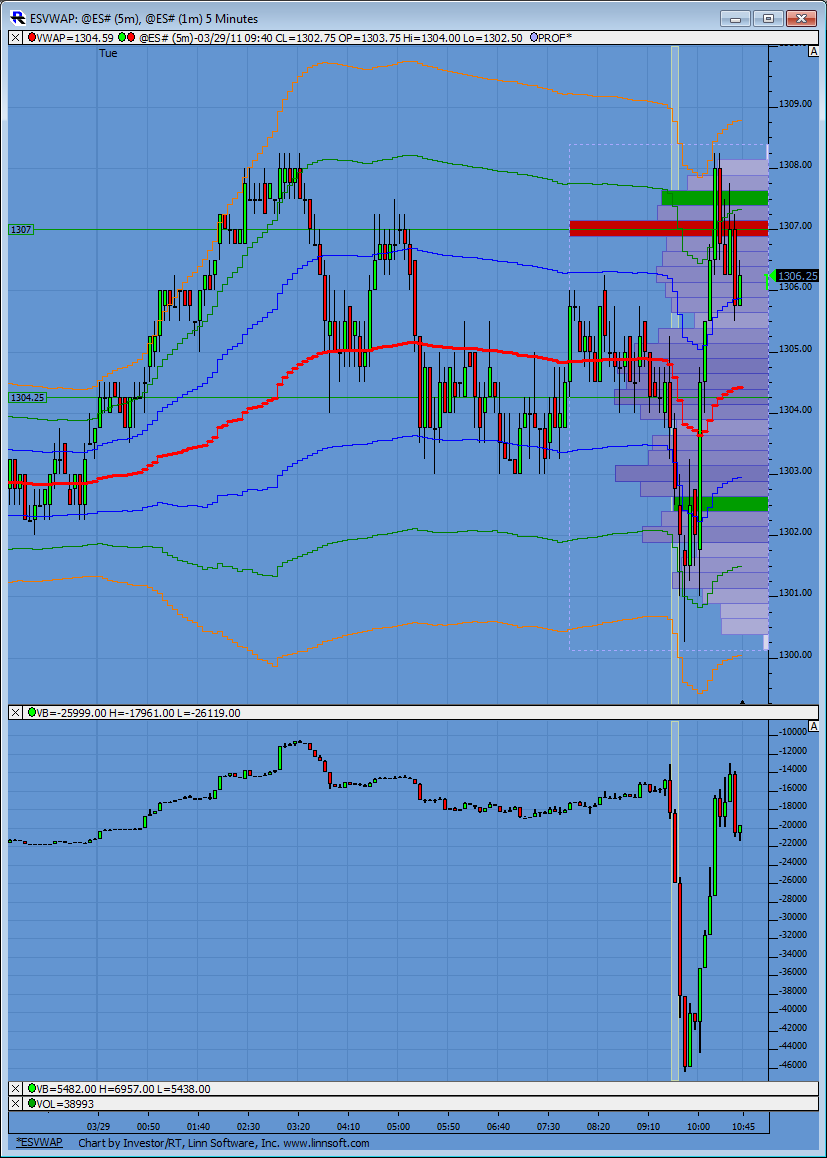
cool ..once again we get to the key zone up at 1307 as mentioned earlier but the high volume bar chart bar has peak volume at 1305.75...buyers can't push it higher on the 10:21 bar...big buyers cannot get price higher////so the market will go back to see where the big TOTAL volume is....and that was 1305.75...
I'm digging this delta..........
I'm digging this delta..........
thanks for those Lorn....I think they want the 1310.25 again so waiting to see what happens up there ..good volume and they fact that they tested the 1305.75 volume and it held makes me think the 10.25 is coming...however sluggish it might be
looks like some are trying to sell up in front of that 10.25 number up here...just watching this one....not crystal clear to me but it sure seems that way
bruce: i have 1311.75 as a target and adjusting from there for a possible 1314. here's my 60 min chart showing the valu area low is there along with a poc 1311.75 just above it.
and that would make sense structurally....todays Value area is developing at 1303 - 1309.50....which so far is lower than yesterdays ...so the POC from yesterday will be critical...and naturally we had volume spikes there yesterday
closed my short. took 1 pt loss.
Emini Day Trading /
Daily Notes /
Forecast /
Economic Events /
Search /
Terms and Conditions /
Disclaimer /
Books /
Online Books /
Site Map /
Contact /
Privacy Policy /
Links /
About /
Day Trading Forum /
Investment Calculators /
Pivot Point Calculator /
Market Profile Generator /
Fibonacci Calculator /
Mailing List /
Advertise Here /
Articles /
Financial Terms /
Brokers /
Software /
Holidays /
Stock Split Calendar /
Mortgage Calculator /
Donate
Copyright © 2004-2023, MyPivots. All rights reserved.
Copyright © 2004-2023, MyPivots. All rights reserved.


