ES key numbers 3-11-11
1390.50 all that great volume on Thursday
1394.50 - a peak volume price based on time and VWAP
1301 - 1302 Thursdays highs and a key area
1308 - 1309- adjusted numbers from March contract
1316 - 1317.50 - adjusted numbers from march contract
It seems like we may be overcooked to the downside so Hoping for a gap lower in the morning to set up buys......and will need to use overnight numbers to key off of as I really don't have any good volume numbers below todays lows..
thx. pal!...sure hope so.. trying to target that 1294, tho ill exit early as usual,if lucky!..Long from 1291.75
nice trade Kool...I'm always impressed with breakout trades especially
wow!, those triangles are money in the bank!... out both at 1293.50!,plus 1.75 on each!
Originally posted by koolblueand yet another bingo on the one min projection i showed at 1294.00!!!
wow!, those triangles are money in the bank!... out both at 1293.50!,plus 1.75 on each!
fwiw... from sentimentrader today..."Since September, every time the Equity-only Put/Call Ratio surged above 0.70, the S&P 500 rallied over the next several days. Out of the 8 occurrences, not once did the S&P lose any more than -1.1% at its worst point during the next three days (the median was only -0.4%).
There was also a big extreme in the ISE Sentiment Index. On the ISE Exchange, only 60 call options were bought for every 100 put options, something we haven't seen since last May the day after the flash crash. Since 2003, a reading this low has either marked a bottom or been within a few days of one (though a few times those "few days" involved some scary short-term selling pressure "
There was also a big extreme in the ISE Sentiment Index. On the ISE Exchange, only 60 call options were bought for every 100 put options, something we haven't seen since last May the day after the flash crash. Since 2003, a reading this low has either marked a bottom or been within a few days of one (though a few times those "few days" involved some scary short-term selling pressure "
I forgot to mention this morning that yesterday was a 3,000,000 vol down day again on the es! And of course ive pointed out several times on the weekend previews the fact that tho the next day(ie: today)usually has a lower low, it is a great buy signal!!
1297.50is the triangle projection, but again ,we should continue working to 1302-1302.25... i really should have kept a runner on, but being safe so i can sleep sometime later!.. btw, with all of the reasons i have given, beginning with my very first post, is anybody buying today? or is every body just to bearish today?
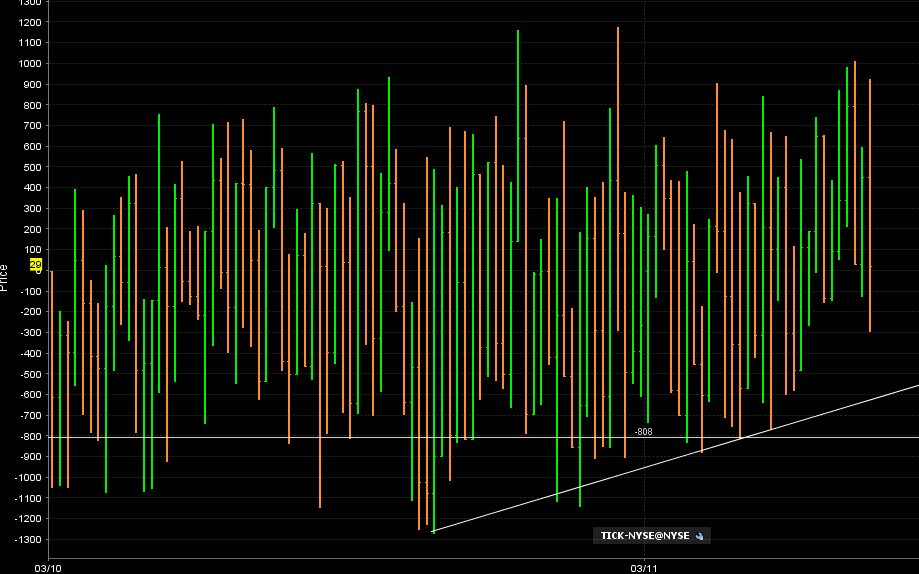
here is the TICK divergence I was seeing.......we had lower lows in price but $tick was holding up....I didn't take the long but tI'm throwing it out for reference
trying a small short from 96.50 to try for the 94.50 retest....
I bought the open for the 90 retest and that has been only long
Originally posted by koolblue
1297.50is the triangle projection, but again ,we should continue working to 1302-1302.25... i really should have kept a runner on, but being safe so i can sleep sometime later!.. btw, with all of the reasons i have given, beginning with my very first post, is anybody buying today? or is every body just to bearish today?
and see where that stopped.......? Right at the Overnight high.....just pointing that out for those who deny the power of the Overnight session..the On high was 93.50!!
Emini Day Trading /
Daily Notes /
Forecast /
Economic Events /
Search /
Terms and Conditions /
Disclaimer /
Books /
Online Books /
Site Map /
Contact /
Privacy Policy /
Links /
About /
Day Trading Forum /
Investment Calculators /
Pivot Point Calculator /
Market Profile Generator /
Fibonacci Calculator /
Mailing List /
Advertise Here /
Articles /
Financial Terms /
Brokers /
Software /
Holidays /
Stock Split Calendar /
Mortgage Calculator /
Donate
Copyright © 2004-2023, MyPivots. All rights reserved.
Copyright © 2004-2023, MyPivots. All rights reserved.
