ES Short Term Trading 02-01-2011
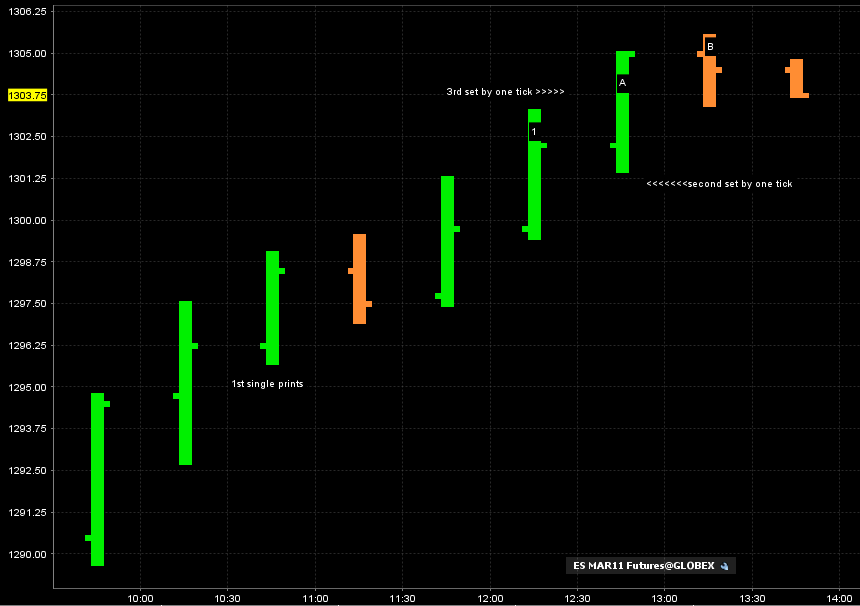
my plan is to add over the current highs as long as 1301.25 doesn't print first because then we will have the second set of single prints on the day and still no retest of a previous 30 minute bar low
just added at 1304.25!!
explanation later...especially if it works...lol..revising first target to 1301.25
just added at 1304.25!!
explanation later...especially if it works...lol..revising first target to 1301.25
dam, stopped again at 1303.50 for a loss of one handle. Playing agaist the trend ,so im being Very cautious on shorts! Last attempt is to sell 1304.50
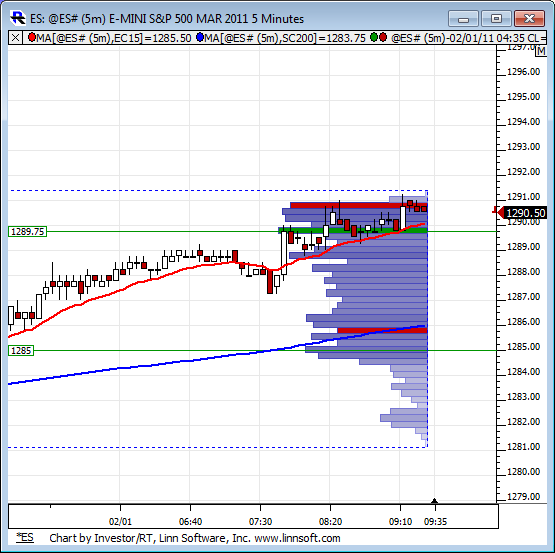
interesting to note Mon range...1283.75 from 1292.25 and since we surpassed the 1.618 mark ,gives a high likely hood of the 200% mark (and i would argue the 2.618!)at...1305.25!
they are trying to push for the 3rd set of single prints which is on the high end of happenings...it does happen and the rule is
"when we trend we lose!!!"
added at 1305 print....looking for the 1303.25 retest..then re examine.......my head !!!
"when we trend we lose!!!"
added at 1305 print....looking for the 1303.25 retest..then re examine.......my head !!!
if this bar closes at 1:30 and we don't test 1303.25 high we will have the 3rd set of single prints on the day.....always a good fade for me.....not perfect but good
that's an official 3rd set of single prints and still no retest of a previous low...they are pushing the statistics on us today....I'm trding still for that 1303.25,,,we may go to the moon but I'll let them prove me wrong up here and will stay short
Originally posted by koolblue
interesting to note Mon range...1283.75 from 1292.25 and since we surpassed the 1.618 mark ,gives a high likely hood of the 200% mark (and i would argue the 2.618!)at...1305.25!
2.618 ... that's 1318.54, right?
1321/22 gives us an intriguing little fib confluence at the 1.618 extension of Friday's range
here is how it is looking in my world...
look at all the higher lows too....and 3 sets of singles..they gonna run down that last low soon
look at all the higher lows too....and 3 sets of singles..they gonna run down that last low soon
Hey DT...do u know why my charts are getting crushed up ? Even full size image looks terrible.....looks great on my screen...LOL
Followers of Kools tools will no doubt remember that since nov, ive tried to speculate on resistances for this amazing rally, I made the case for 1302.50 (achieved), 1305.50 (hit today!) and 1312. Yet another reason , along with KOOLS CYCLE TURN DAY, THAT I HAD TO SHORT AGAIN!... IM TAKING ONE OFF AT 1303.50 and holding the runner for a bit.
Originally posted by BruceM
Hey DT...do u know why my charts are getting crushed up ? Even full size image looks terrible.....looks great on my screen...LOL
Looks good to me - any chance that your browser is doing it?
If not, can you take a screen shot of the in-browser and on-desktop versions of the images and send them to me and I'll try and work out what the problem is?
Emini Day Trading /
Daily Notes /
Forecast /
Economic Events /
Search /
Terms and Conditions /
Disclaimer /
Books /
Online Books /
Site Map /
Contact /
Privacy Policy /
Links /
About /
Day Trading Forum /
Investment Calculators /
Pivot Point Calculator /
Market Profile Generator /
Fibonacci Calculator /
Mailing List /
Advertise Here /
Articles /
Financial Terms /
Brokers /
Software /
Holidays /
Stock Split Calendar /
Mortgage Calculator /
Donate
Copyright © 2004-2023, MyPivots. All rights reserved.
Copyright © 2004-2023, MyPivots. All rights reserved.

