ES Short Term Trading 12-8-10
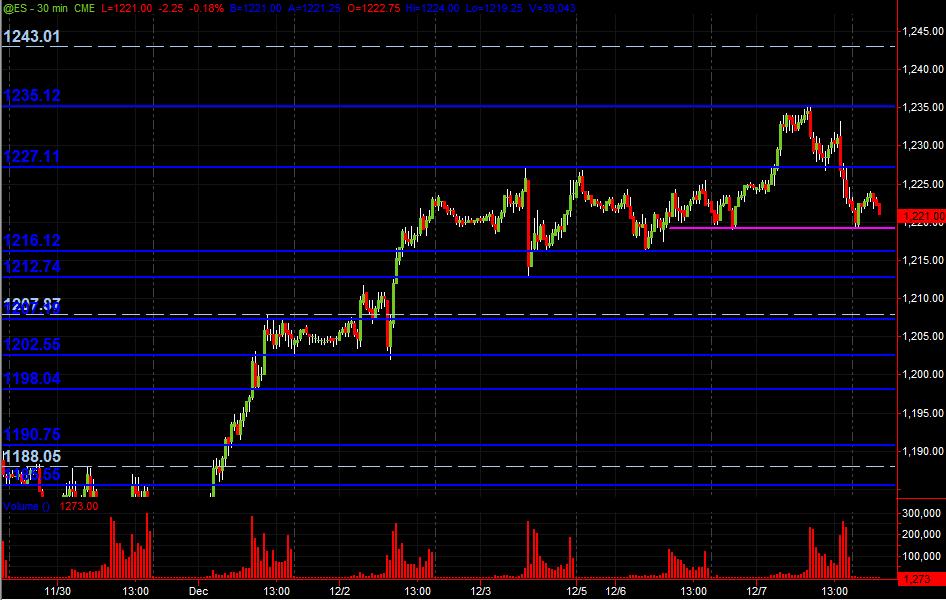
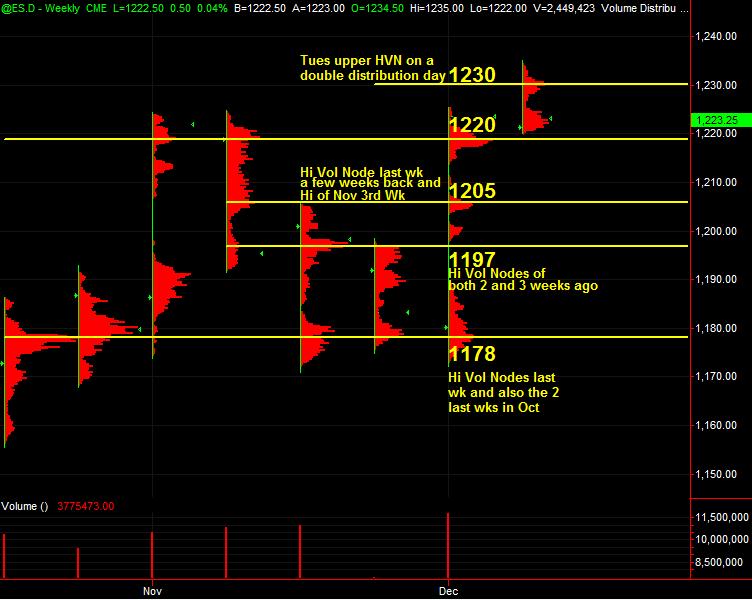
Just to kick off the topic with what I've got on an ES 30-minute chart showing PASR levels in Blue with the light dashed lines being Wkly Pvt levels. Merely a "map" coming into Wednesday's trading. Also, am posting from TradeStation charting, the Weekly Volume at Price HVN price areas from RTH. Not much changes in price levels from last posting of my charts. Hope some folks find this useful!
only thing left to fill in is 23.50 to make it PERFECT
flat at 26 even...not fading anymore as we are getting late and back in low volume from YD trade...could move quick if us faders have it wrong ...right through YD low volume...point is that I'm not sure so getting out
Short one from 1127.00, trying to be patient, but stop is quite tight at 1129.00// looking for 1123 area or eventually 1121.25
will it close neutral in center or neutral extreme??
my guess is neutral, Dax closed neutral lowish
Going to cover 1225.00 as im running out of time (if they let me!)
BINGO...1125.00 .. NICE DAY OFF TODAY.. Good luck trading to all! (actual exit was 1125.25)
Emini Day Trading /
Daily Notes /
Forecast /
Economic Events /
Search /
Terms and Conditions /
Disclaimer /
Books /
Online Books /
Site Map /
Contact /
Privacy Policy /
Links /
About /
Day Trading Forum /
Investment Calculators /
Pivot Point Calculator /
Market Profile Generator /
Fibonacci Calculator /
Mailing List /
Advertise Here /
Articles /
Financial Terms /
Brokers /
Software /
Holidays /
Stock Split Calendar /
Mortgage Calculator /
Donate
Copyright © 2004-2023, MyPivots. All rights reserved.
Copyright © 2004-2023, MyPivots. All rights reserved.

