ES Short Term Trading 12-8-10
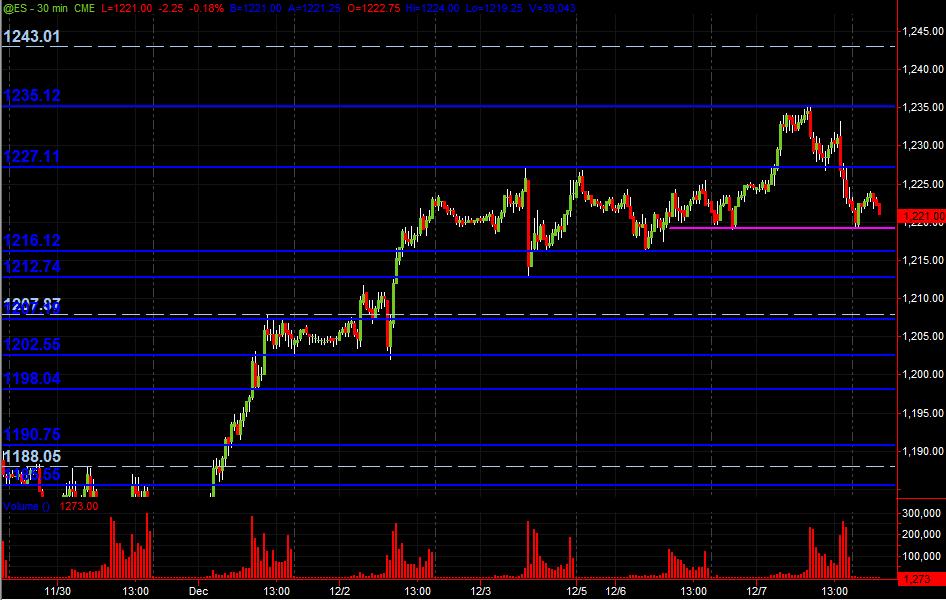
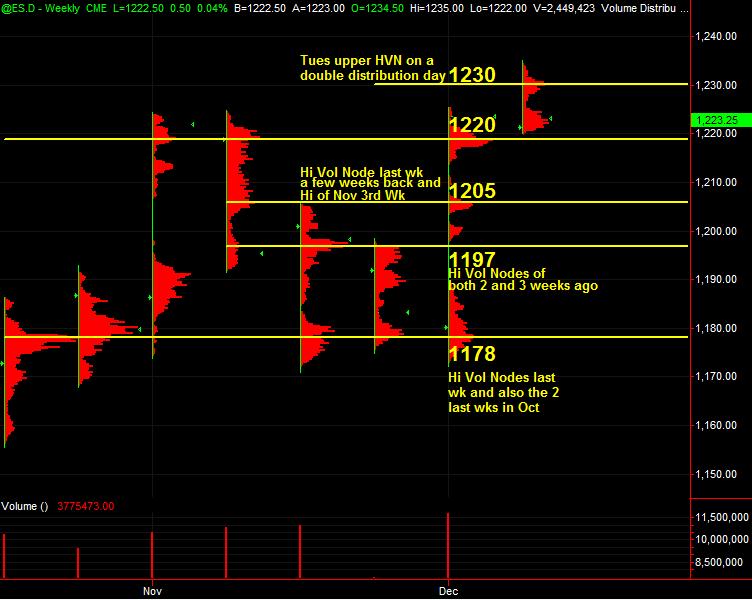
Just to kick off the topic with what I've got on an ES 30-minute chart showing PASR levels in Blue with the light dashed lines being Wkly Pvt levels. Merely a "map" coming into Wednesday's trading. Also, am posting from TradeStation charting, the Weekly Volume at Price HVN price areas from RTH. Not much changes in price levels from last posting of my charts. Hope some folks find this useful!
I'll be surprised NOT to see a complete gap fill but how much up swing do we need to withstand against our open equity on runners?
runners always tuff!!!
runners always tuff!!!
covered all at the 23.50 4 pm close...I just have no good stop placement for those last two...so best to exit....will think of reselling on a push up if they don't get 4:15 gap now first..
Great work Bruce!
I see no accumulation at all, even with a gap up, same was yesterday.
DJ is below prev. day low. NQ still above it.
I see no accumulation at all, even with a gap up, same was yesterday.
DJ is below prev. day low. NQ still above it.
thanks Kool and glad u r here.....always tuff to watch market go further after an exit...I suppose a better trader, a bigger account trader or a trader with bigger Kahunas than I could've held that but I'm always trying to train myself to be satisifed in trading and in life......I won't chase it...and stop placement on runners is one of many trading areas that I haven't mastered.....that one alludes me!.
so ends todays motivational speech....!more babble than usual !!
so ends todays motivational speech....!more babble than usual !!
thanks and one of the things I'm working on is the continued effort of the one minute volume work.....Yesterday according to my IB clumped data that big down bar had 43 K in volume...today so far the biggest one is 27 k...the point being that the market each day will be attracted to one or more of these 3 things......
the volume from the previous day or the volume ( one minute bar volume not VPOC's exactly)from the O/N session...sometimes both....now what happens there is the real trick
or it will create new volume and jerk around that for the day..
Today we got atrracted up to the volume bar from YD rth range and then fell back to the volume from the O/N session as per the one minute spike and then lorns VPOC
so I'm just throwing out the concept ....
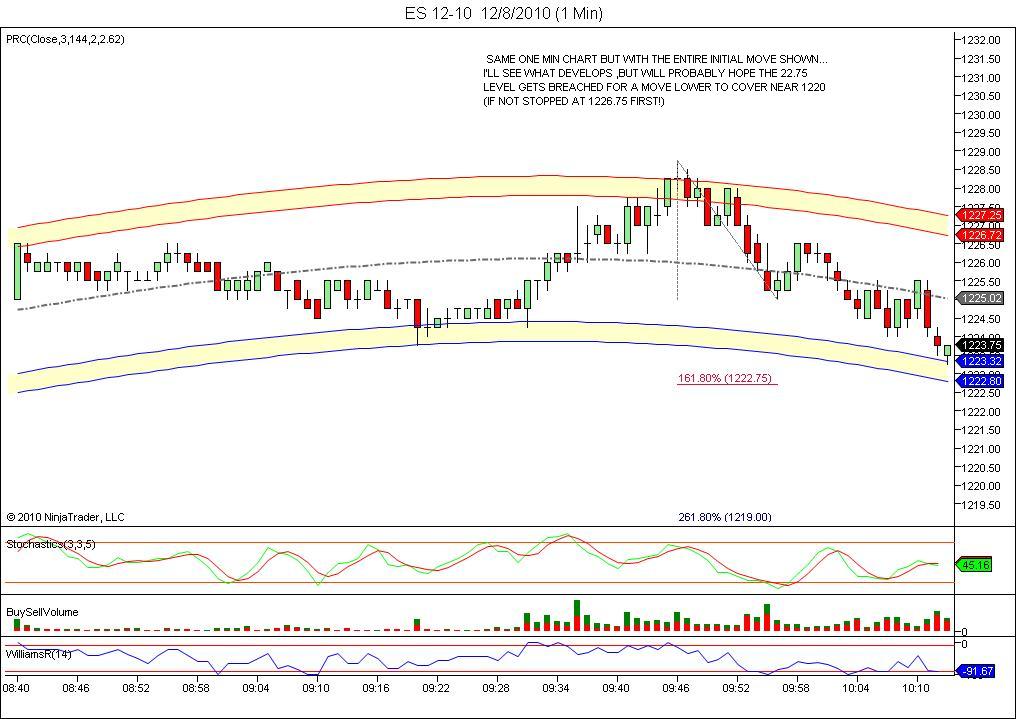
so the 22.50 - 22.75 continues to be a point of interest..look at volume spike into it ...all a work in progress
RUNNER COVERED AT 1219.75.. all in all 9.5 handles in the bank
and well done to u 2 kool...I just got to your charts.....
now attempting to buy one at 1219.00 for a bounce... not filled yet
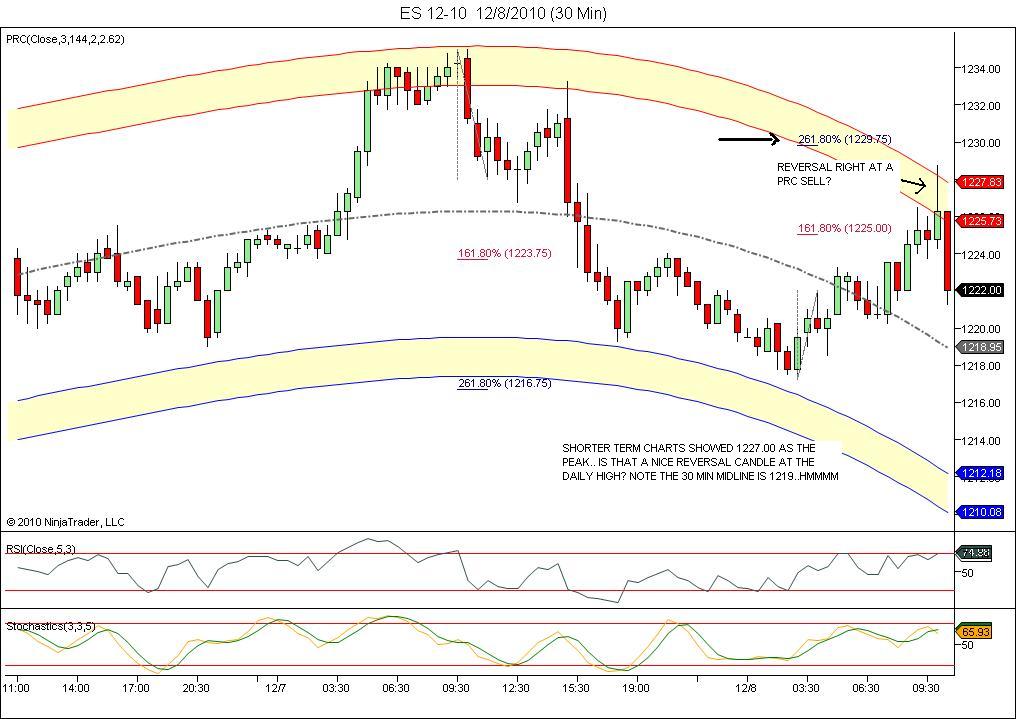
BINGO...1125.00 .. NICE DAY OFF TODAY.. Good luck trading to all! (actual exit was 1125.25)
Emini Day Trading /
Daily Notes /
Forecast /
Economic Events /
Search /
Terms and Conditions /
Disclaimer /
Books /
Online Books /
Site Map /
Contact /
Privacy Policy /
Links /
About /
Day Trading Forum /
Investment Calculators /
Pivot Point Calculator /
Market Profile Generator /
Fibonacci Calculator /
Mailing List /
Advertise Here /
Articles /
Financial Terms /
Brokers /
Software /
Holidays /
Stock Split Calendar /
Mortgage Calculator /
Donate
Copyright © 2004-2023, MyPivots. All rights reserved.
Copyright © 2004-2023, MyPivots. All rights reserved.


