ES key levels on the downside
some levels as we go forward....downside only..wishful thinking perhaps as the world seems on bullish. Ranges are fairly small so zones are tight...not much room from level to level
1213.50 - 15.25 - VPOC and spike initiation point ****** key support for friday,,longs don't want it to open below that on Friday morning!!
1207.50 - 09.50 Thursdays RTH open and low volume
1202 - 1204.75 - VPOC from Thursdays O/N session
1197- 98.75 Gap and VPOC from ON
87 -91 VPOC and low volume - may rotate here a bunch to fill in the profile
84.50 - low volume area begins and HV from composite
78 - 81 ***** major support , the center of the universe....we have been watching this number for a long time
Originally posted by day trading
Originally posted by pt_emini
... a paper umbrella candle ...
"paper umbrella candle?"
Do you have a chart of that? I haven't seen one of those before...

best fill is 22 even after the 21.75 print...have two left but this point is critical.....trade back up will not be a fade and will stop runners at 24...otherwise next target 20.25 and then will try to hold last for 18.50
Trying again on the short side, took break of OR low for 1222.75 entry... initial stop at 1224.25, usual trailing stop order management.
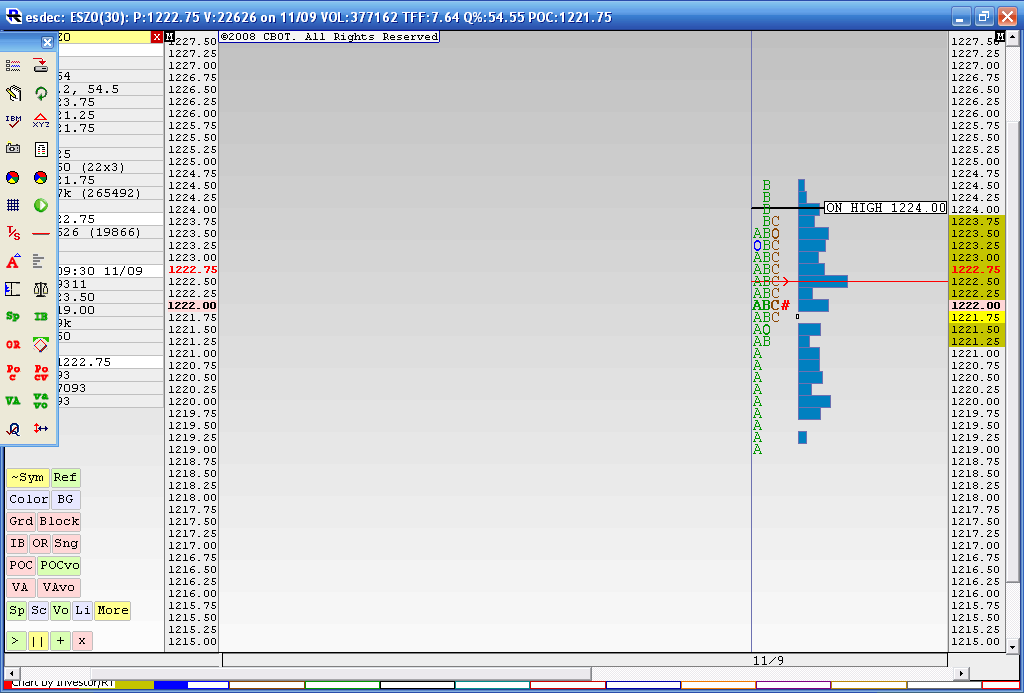
here is how it looked in my world....Look at O/N high, the peak volume ( Red line) at 22.50 and probably most important is that little box and the low volume at "C" period low.....the little box was not only the midrange on the day but low volume...
I'm not sure If there are many volume/MP players here but hope this helps.....now one reason I was planning to add up at 26 area is because I have a number at 27 but ADDITIONALLY if you take the HV at 22.50 and add the distance to the current low you would get 26...
Also look at the little volume buldge at 1220...so I just exited one at 20.25 ..ahead of that buldge
sure hope I'm not wasting my time or the forums with this MP/VP ramblings...
Originally posted by BruceM
sure hope I'm not wasting my time or the forums with this MP/VP ramblings...
Not at all Bruce, much appreciated, I am learning good stuff every day !
I had not even noticed that high vol at 22.50 until you pointed it out, and it's sitting right there on one of my charts !
Looking back, that was a really nice turn off 24.50.
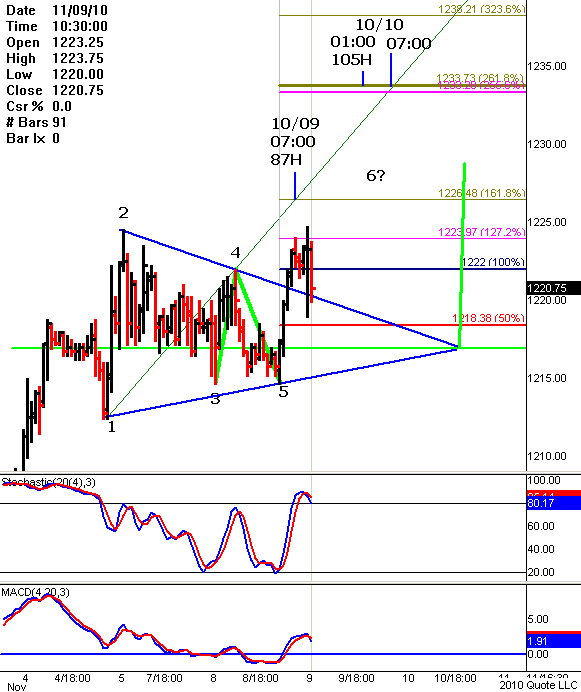
Here is a 60M all sessions chart with the objectives and also a WW projection, including possible times and possible future objectives. maybe my posts are not for this forum lol Anyhow I hope it helps...
Originally posted by i1hunter
ES currently moving towards the 1226. On the 60M chart I had 87 hours (07:00) from 1179 to 1226.00 but did not make it. Next time is 109 hours or tomorrow at 01:00 to possibly 1235.00 objective. To void the above the ES will have to move below 1214.00 today. (A bit too low but that's how the system has it) ES now trading at 1223.50 @ 10:31
Originally posted by i1hunter
I got stop out B.E. and the projection was voided.
IN the 60m chart I can count a 5 EW up, but I don't know if it is a 5 of 3, if it is. then we still have one more impulse up. Or currently making an a,b,c,d,e of a #4 then 5# up.
Will see, in due time the market will show me the way
Originally posted by i1hunter
I have a projection to 1226 by 11:30 or so.
The projection will be void if moving below 1215.25 ES no trading 1219:00 @ 10:27
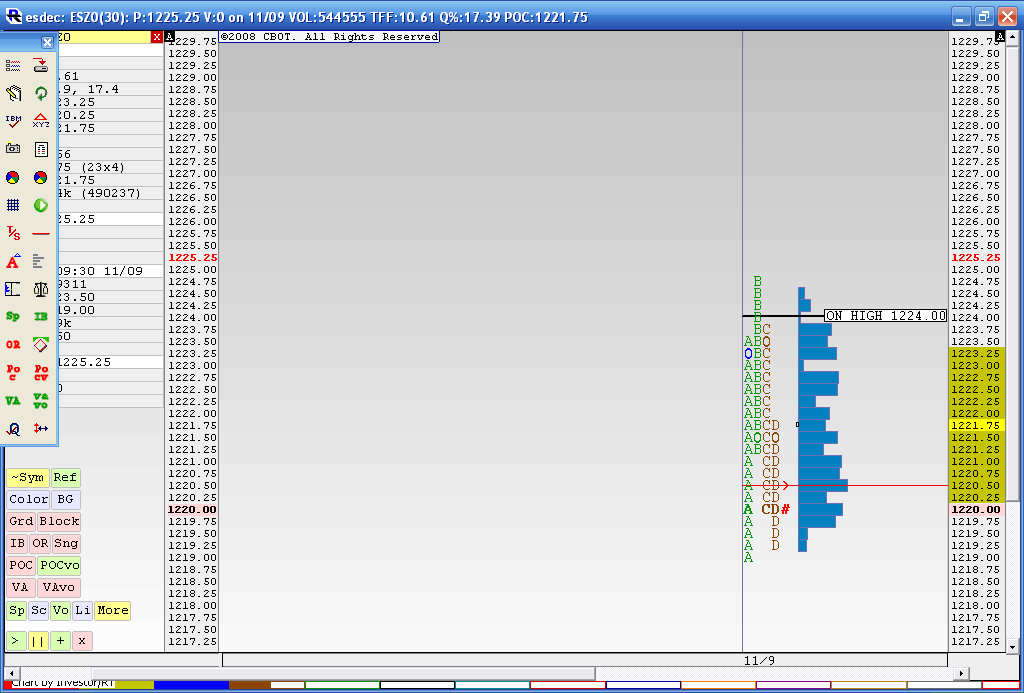
Ok PT...and thanks for the feedback...the HV node shifted from 22.50 down to 20.50 which in theroy says that price is attracted to LOWER prices....So now that 20 - 21.75 becomes resistance and hopefully I will get that ledge run below todays lows in YD range
took 1 off again at yesterday's POC 1219.00 (+ 2 ticks to ensure fill), trailing stop to 2 ticks above Bruce's 1222.50 1221.50 HV level.
Does anyone know how to embed a Jing video into a thread posting ?
http://screencast.com/t/NbXbmBgAUy
Does anyone know how to embed a Jing video into a thread posting ?
http://screencast.com/t/NbXbmBgAUy
here is how my profile looks...and I can post this stuff because I have only the one contract left...I don't want trade back near 21.75 now to stop me out
Emini Day Trading /
Daily Notes /
Forecast /
Economic Events /
Search /
Terms and Conditions /
Disclaimer /
Books /
Online Books /
Site Map /
Contact /
Privacy Policy /
Links /
About /
Day Trading Forum /
Investment Calculators /
Pivot Point Calculator /
Market Profile Generator /
Fibonacci Calculator /
Mailing List /
Advertise Here /
Articles /
Financial Terms /
Brokers /
Software /
Holidays /
Stock Split Calendar /
Mortgage Calculator /
Donate
Copyright © 2004-2023, MyPivots. All rights reserved.
Copyright © 2004-2023, MyPivots. All rights reserved.


